Category: Electricity

  • Chasing down electricity usage

    Chasing down electricity usage

    Working to minimise usage

    We will be using our battery to power our electric heating and so we want to minimise usage. After setting up the monitoring of energy flow in Home Assistant I noticed that we were drawing 300W-400W of energy overnight. This ends up using about 10%-15% of our battery storage.

    There are a number of things in the house which we leave on overnight and draw some power. The fridge obviously, but also the wireless routers, a few raspberry pi computers and some LED lights. Looking at the sources I knew about, it still seemed like less than 400W.

    Looking for the unknown usage

    I have been using a couple of Shelly 1PM devices to switch on and off and monitor our coffee machine, and other appliances. These are easily integrated into home assistant and very reliable. I used one of them to monitor some of our appliances and nothing looked like a huge user of power.

    I decided to try and measure everything we kept powered on at night. To do this I purchased a bunch of inexpensive Tapo smart plugs and integrated them into HA.

    What the usage looks like

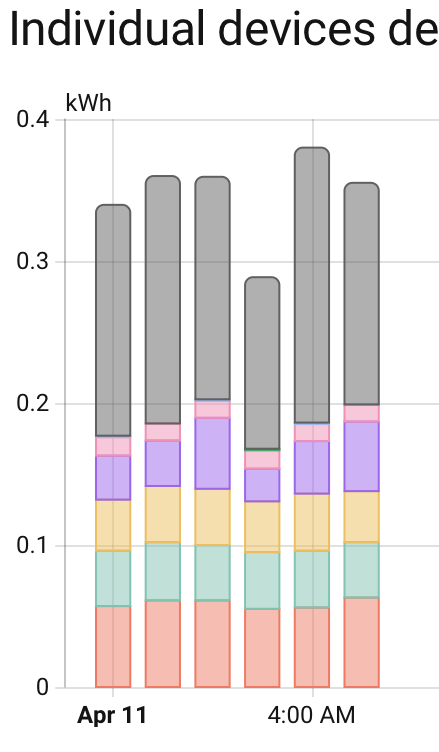
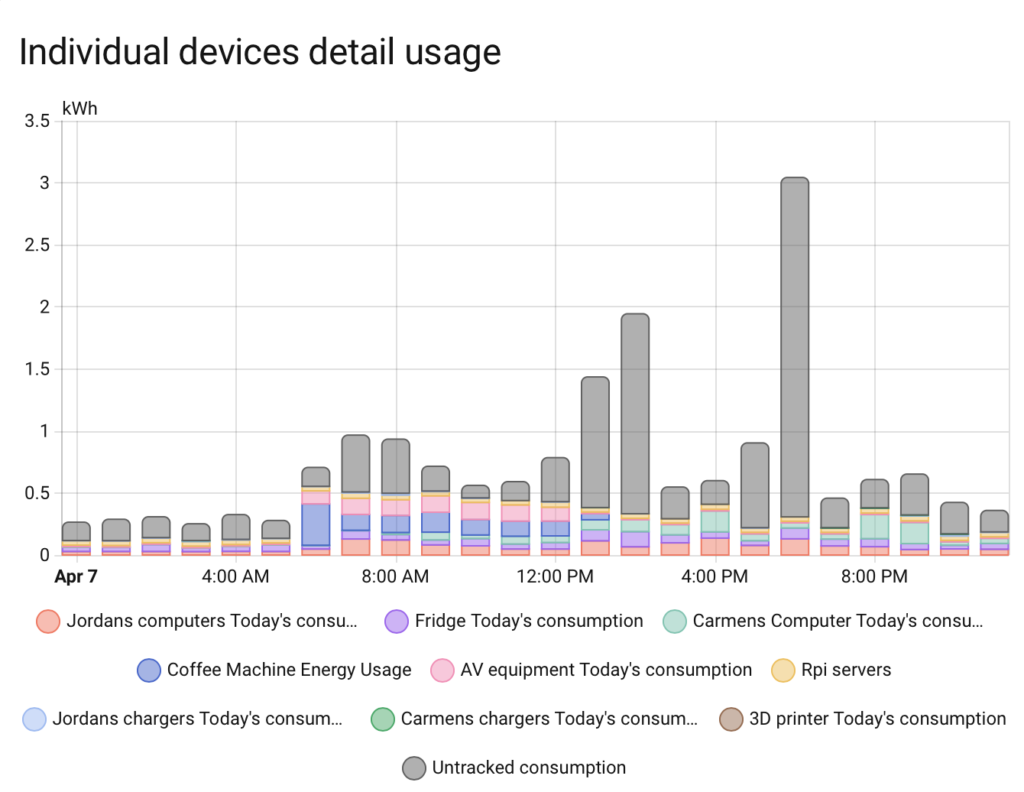
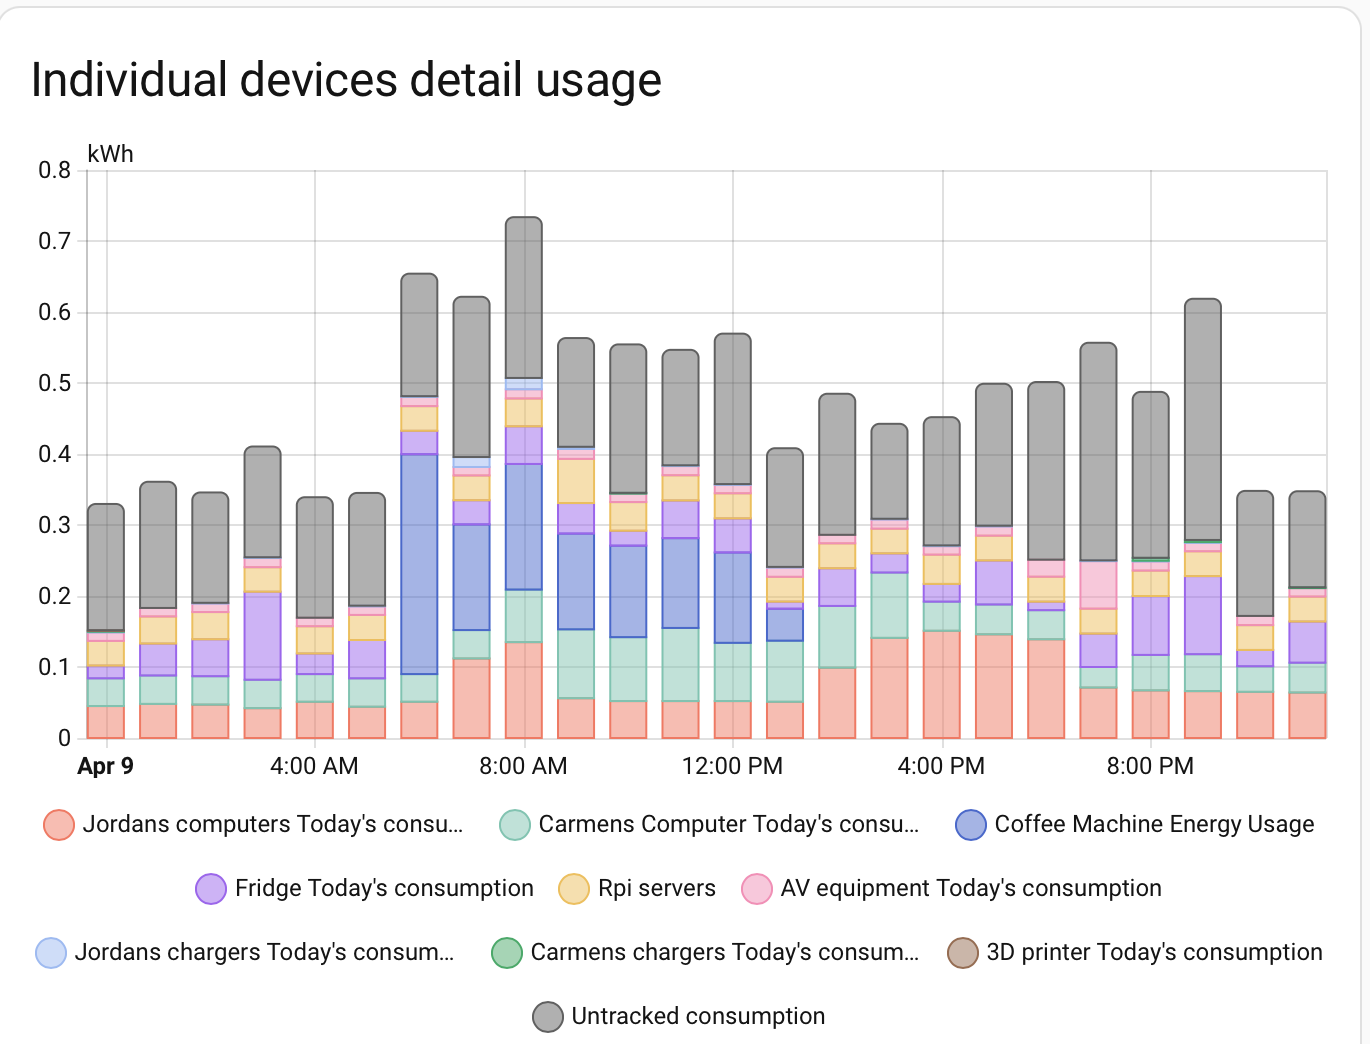
    Although I don’t monitor everything I did try to assess all the usage. I checked every outlet in the house, and measured everything that was plugged into them at least once. I left the Tapos on the biggest users, and assessed that the unmeasured devices draw less than 20W. The chart below shows all the devices I measure. Dark grey is untracked consumption. During the day there are a handful of appliances I don’t measure. These include the stove, hair dryers, the kettle. I can clearly see spike in usage during the day when these are on.
    Daily usage measurements. Untracked usage is dark grey.

    Overnight usage on the other hand is pretty steady, and only the fridge fluctuates its current draw as it cycles its cooling on and off.
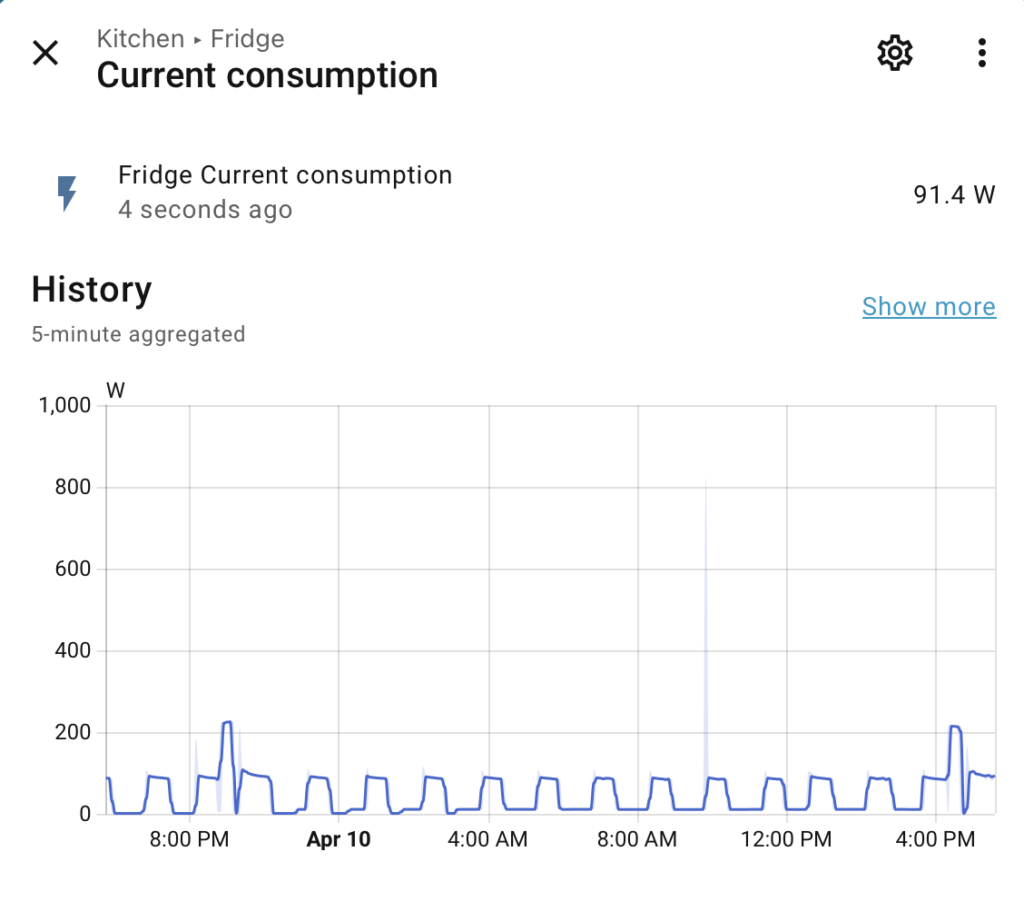
    Fridge power usage during a day. It draws between 10W and 100 W as it cycles on and off.

    Some of the servers remain on overnight, but their current draw is steady around 60 W for this group.
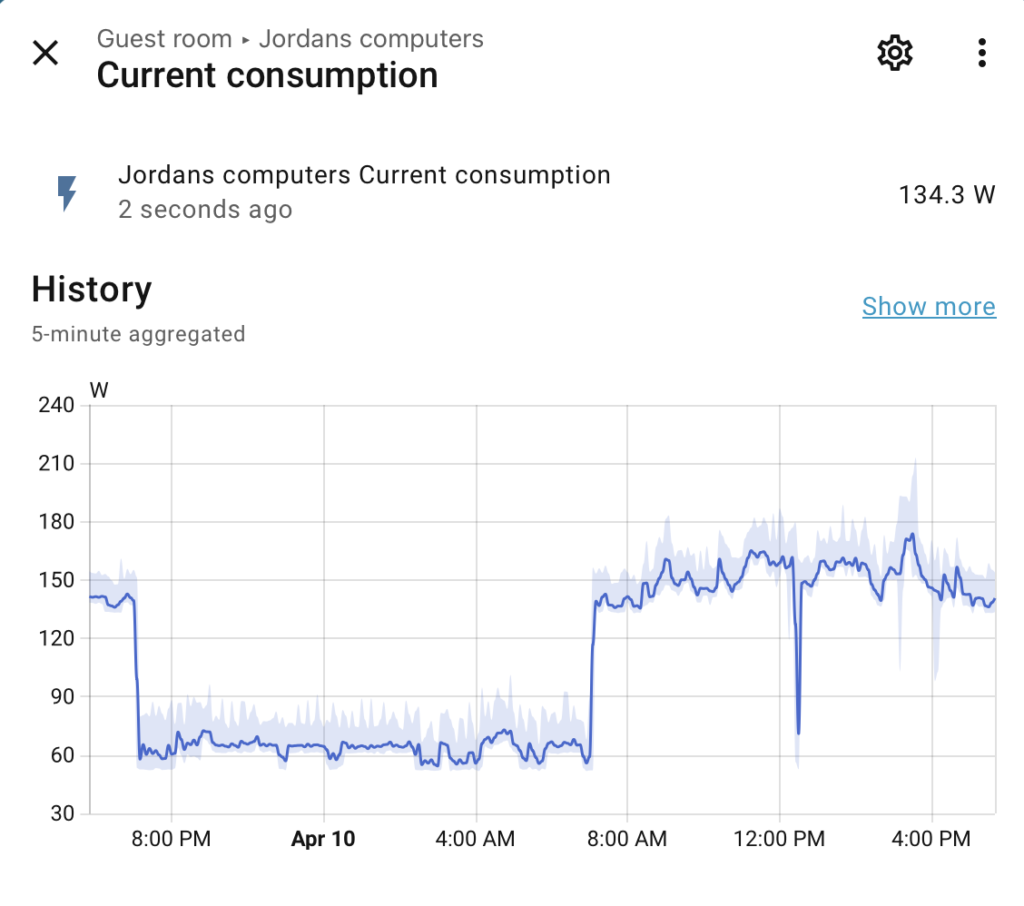
    Computer usage during a day. Some of the computers remain on and draw 60W overnight.

    After tracking the overnight current draw for a number of nights it was clear the current draw was consistent. It was also clear that the power being used in the house was not 300W-400W. Adding up all the measured usage and also estimating the contributions for devices I not measuring the current draw at night is closer to 150W-250W.

    Battery discharge does not equal power usage

    There isn’t any mysterious device hidden somewhere drawing 100W. The statistic of total energy usage in Home Assistant is essentially the battery discharge as we are not drawing from the grid. The current we draw overnight is less than the battery discharge. The most likely reason for this seems to be the inverter.

    Our battery needs to convert DC to AC in order to power the house. This is quite efficient when there is a large current draw, but for small current draws it seems to be much less efficient. This seems to be responsible for most of the untracked consumption which shows up overnight in the figure above. It has been useful understanding all the appliances which do draw power, and I will need to consider whether I want to power some of them off overnight.

    Closer look at overnight usage
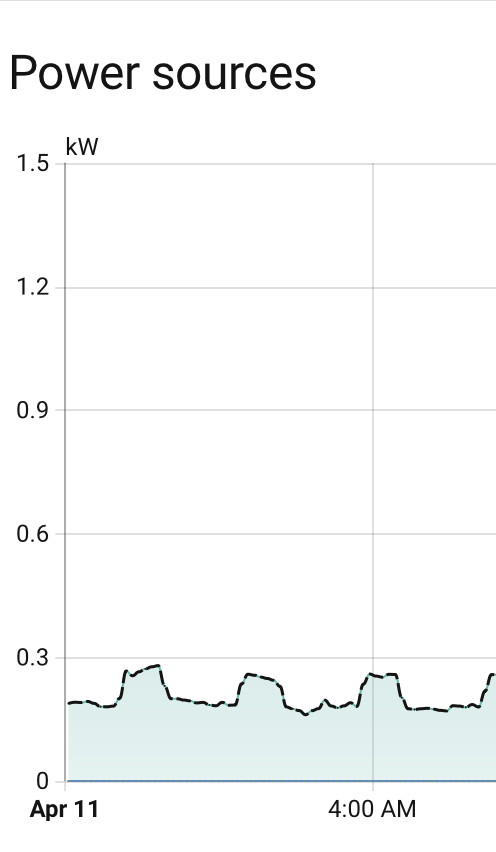
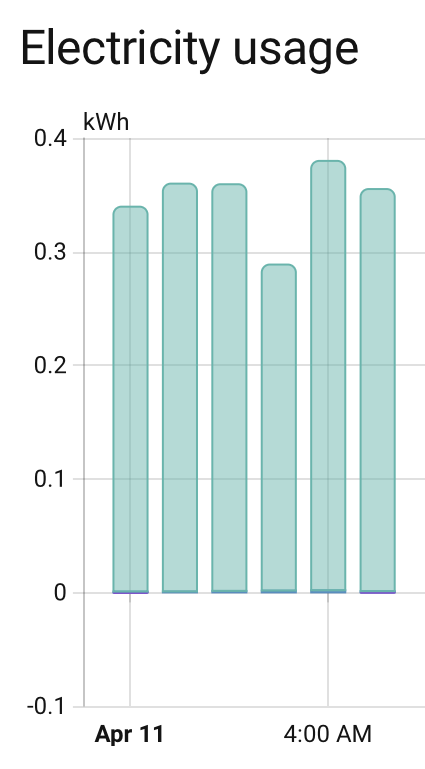
    The images above on the left shows the power consumption in kW being used in the house overnight. The middle image shows all the measured energy use in the same period. The image on the right shows the measured energy being discharged from the battery to feed the household usage. The untracked (dark grey) in the middle plot is mostly coming from inverter losses.
  • Measuring energy flow with Home Assistant

    Measuring energy flow with Home Assistant

    Energy flow in the HA dashboard

    Understanding the energy flow in our household will be critical in trying to reduce dependence on the grid. We also want to maximise our use solar energy.

    Summary tab

    The HA Energy dashboard Summary tab provides useful overview on where and when we are producing and using energy.

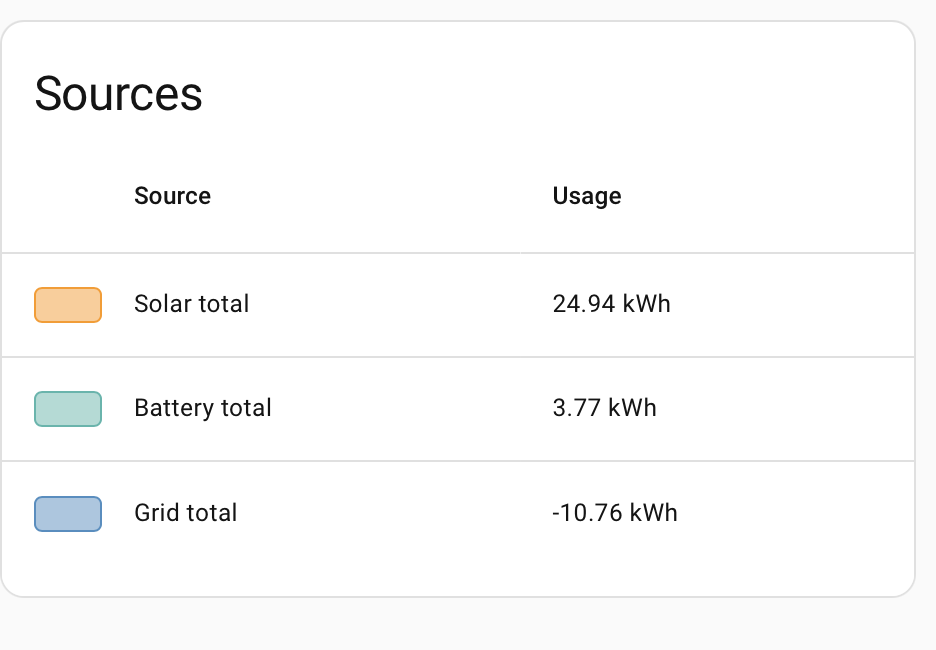
    The Sources pane on the dashboard shows net usage from solar, the battery and the grid. On this day we used around 25kWh from the solar for the home and to charge the battery. We fed in the rest to the grid. Our net use of the battery was 3.77 kWh as we used more from the battery this day than usual.

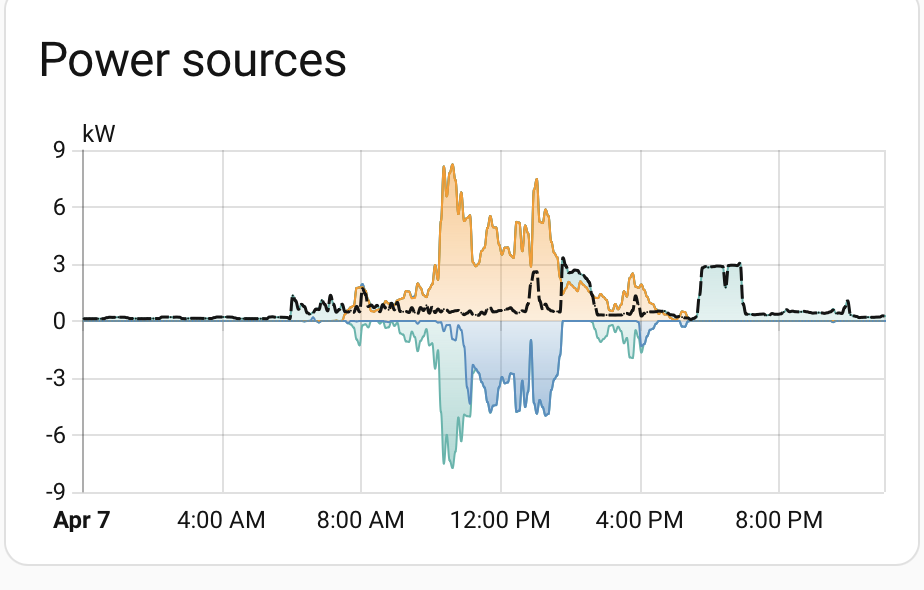
    The Power sources pane shows the energy flow during the day. Here we see the battery use during the evening (cooking ) and then a small steady amount of overnight usage. During the day, the solar charges up the battery, and provides all our home’s electricity. The Solar which is left over is fed back to the grid.

    Energy tab

    The Energy tab in the dashboard offers a number of useful diagnostics for seeing where energy is being used and produced in more detail.

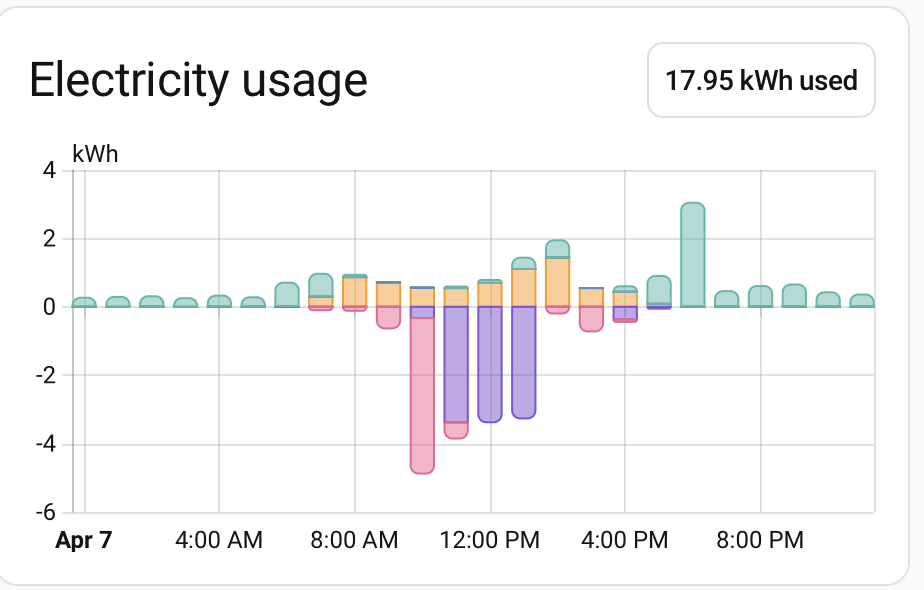
    The Electricity usage pane details where we use electricity (on an hourly basis). This shows the battery charging in pink, the grid feed-in in purple. The household use from battery is in green and household use from solar in orange.

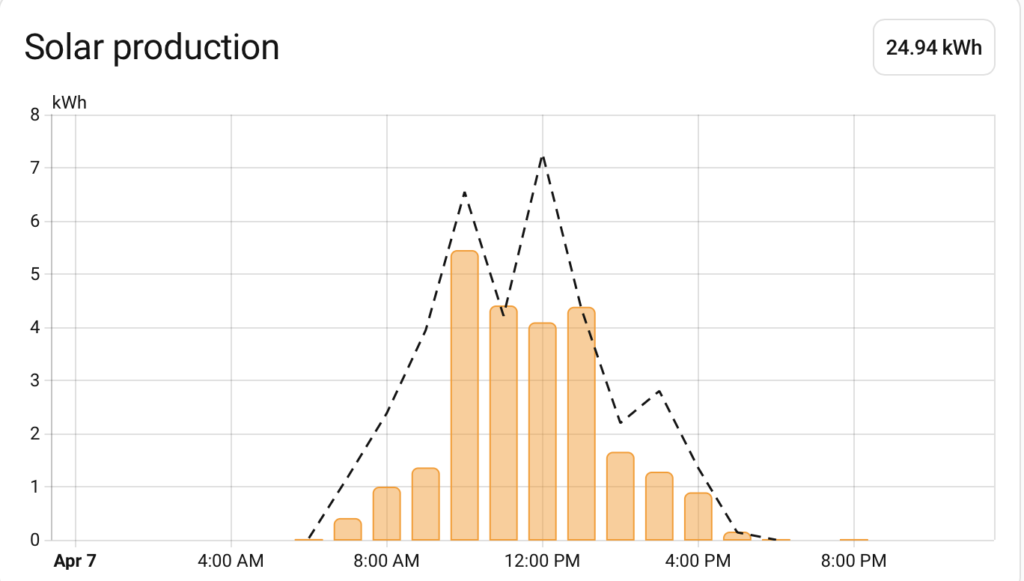
    The Solar production pane gives an hour by hour look at the solar produced, and also shows the prediction for what we expected given by the solcast integration.

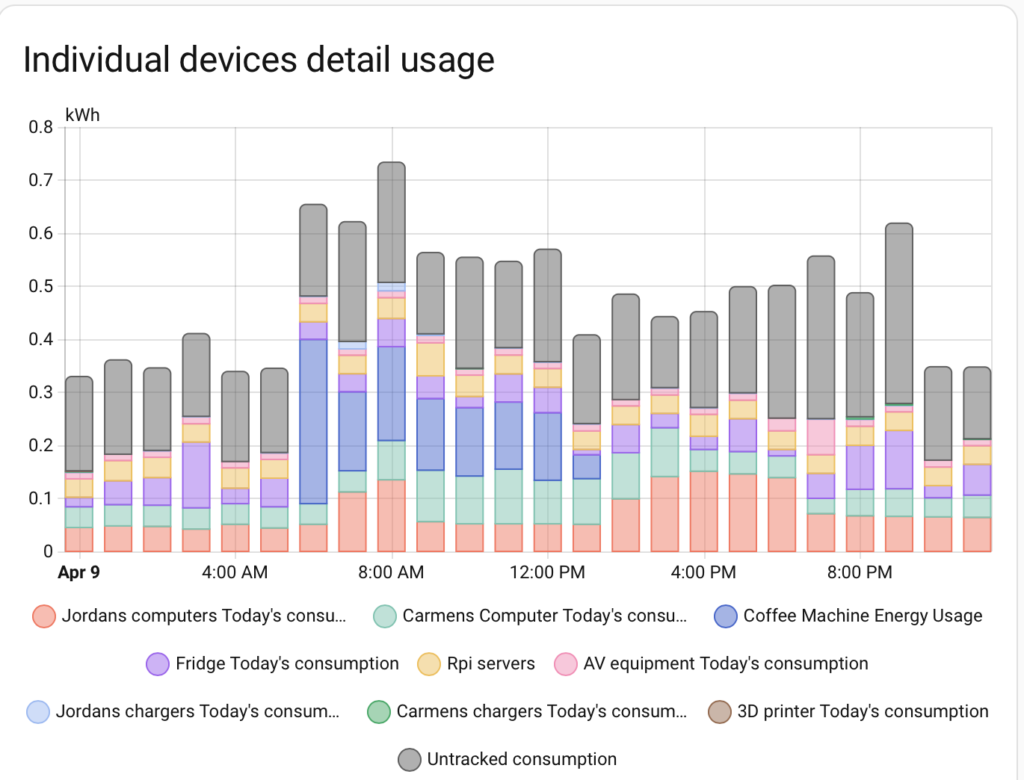
    There is also the possibility to track more detailed use of individual devices. The summary plot looks like this.

    I have put in a number of devices to track electricity usage in the household. I haven’t tracked everything, there are big untracked spikes from running the washer/dryer and the oven. There was something which was really bothering me though. We are using the battery to run everything overnight, and there was a steady draw on the battery of around 250 watts overnight. I tried to find if there was a culprit for this. I’ll describe what I did to measure this, and what I found out in another post.

  • Solar system size

    Solar system size

    Our goal for our home is to move completely off of gas and onto electricity and we need the solar system size to be adequate for the task . When we started, we were not heavy users of electricity, using 10-15 kWh per day, with our biggest uses coming from household appliances (washer, dryer, fridge, oven). We had gas for ducted heating, hot water, and stove top. Although the bills for gas were seasonal they were larger on an annual basis.

    When considering how large a solar/battery system we wanted to install, we wanted to be able to avoid drawing from the grid as much as possible once we replaced our gas appliances, but were realistic about not sizing the system too large. We also want to be able to charge an EV in the future, so that motivated putting in a reasonably large number of panels to be able to power the house and also charge the car using solar as much as possible.

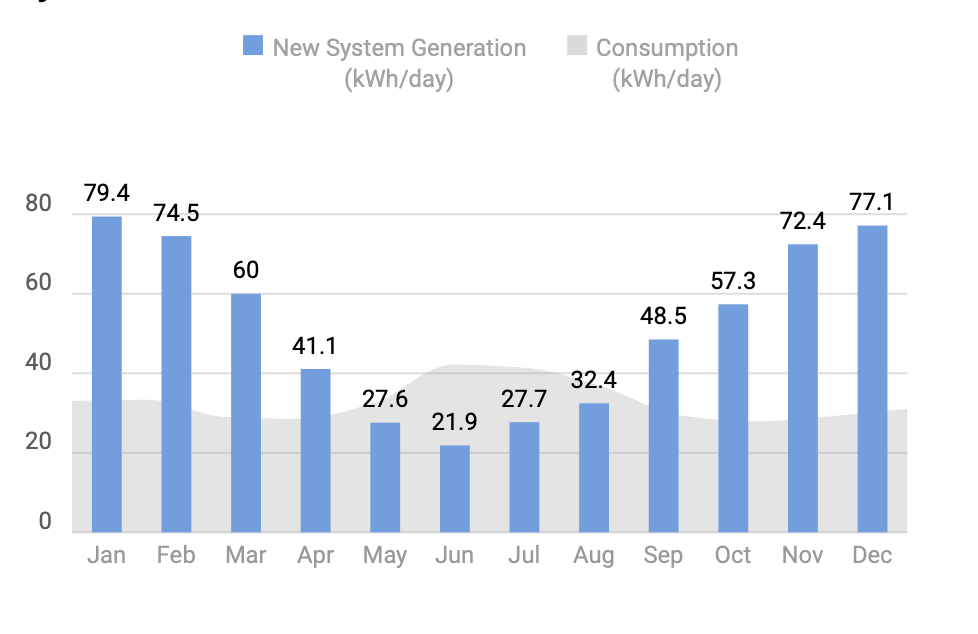
    We asked the solar provide to help size a system for us and they provided the model shown below

    Solar production and electricity usage model

    Proposed solar system size

    The system they proposed had 30 PV panels (480 W each) placed on three of our home roof surfaces (E-8/W-13/N-9) and 27kWh of battery storage. The plot shows a model of our energy usage with heating and cooling and hot water moved to electricity in grey, and the average expected daily solar output in blue.

    As feed-in tariffs are now essentially 0 in Victoria, there was no financial incentive to overproduce solar for feed-in, however this leaves a lot of potential to charge an EV for much of the year using only solar. This works for us as we often leave a car parked at home in the day and commute by bicycle. This size system also deals with the very large difference in solar production and energy usage in Melbourne throughout the year. Our largest electricity use for the home will be in winter (air conditioning is not really something we need very often) and that is when solar production is at a minimum.

    The battery will allow us to time-shift electricity production from the day to the evening/morning when we need the heating, and also allow us to heat the house during the day which is something we have not really done with gas heating due to the expense.