Energy flow in the HA dashboard
Understanding the energy flow in our household will be critical in trying to reduce dependence on the grid. We also want to maximise our use solar energy.
Summary tab
The HA Energy dashboard Summary tab provides useful overview on where and when we are producing and using energy.
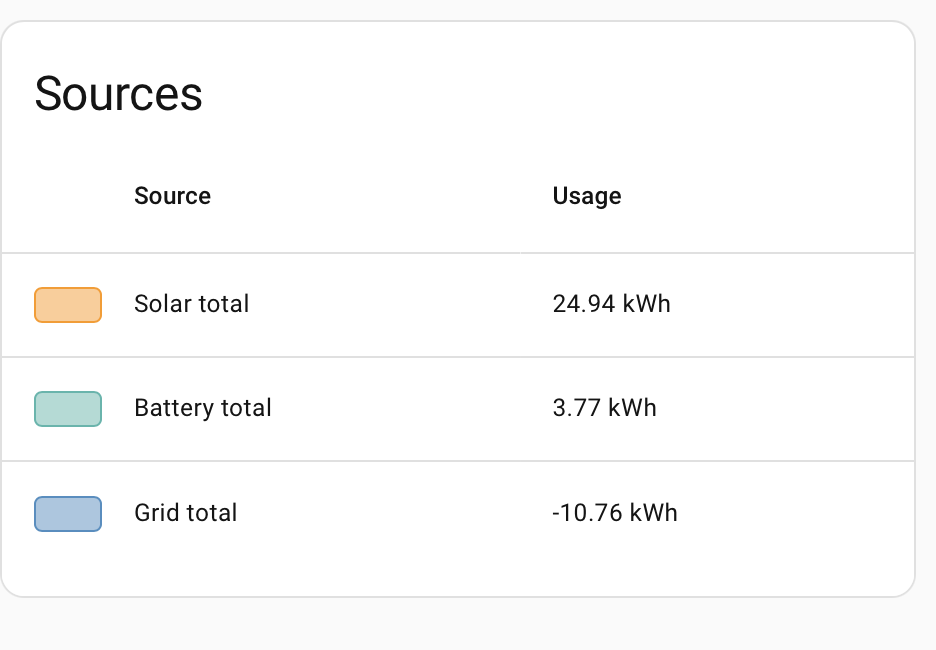
The Sources pane on the dashboard shows net usage from solar, the battery and the grid. On this day we used around 25kWh from the solar for the home and to charge the battery. We fed in the rest to the grid. Our net use of the battery was 3.77 kWh as we used more from the battery this day than usual.
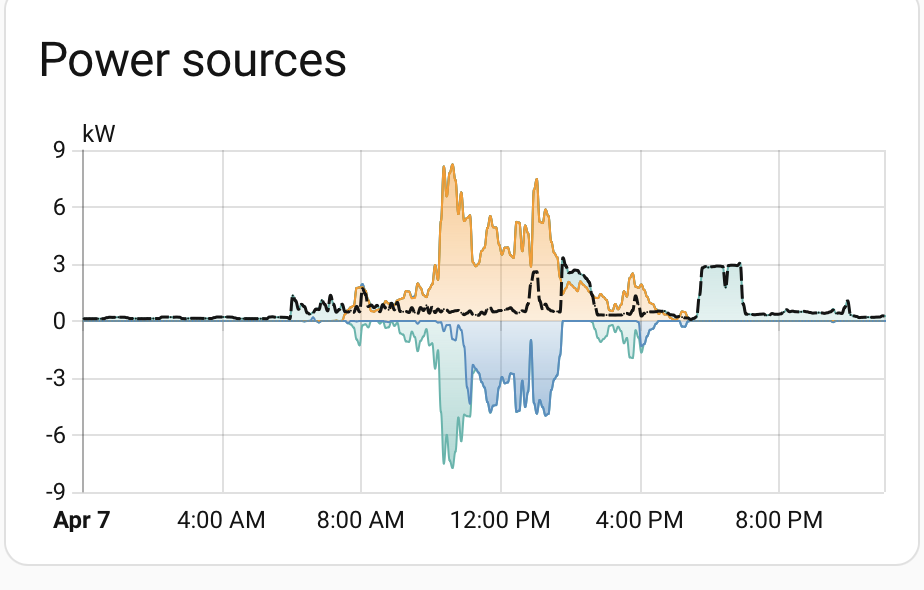
The Power sources pane shows the energy flow during the day. Here we see the battery use during the evening (cooking ) and then a small steady amount of overnight usage. During the day, the solar charges up the battery, and provides all our home’s electricity. The Solar which is left over is fed back to the grid.
Energy tab
The Energy tab in the dashboard offers a number of useful diagnostics for seeing where energy is being used and produced in more detail.
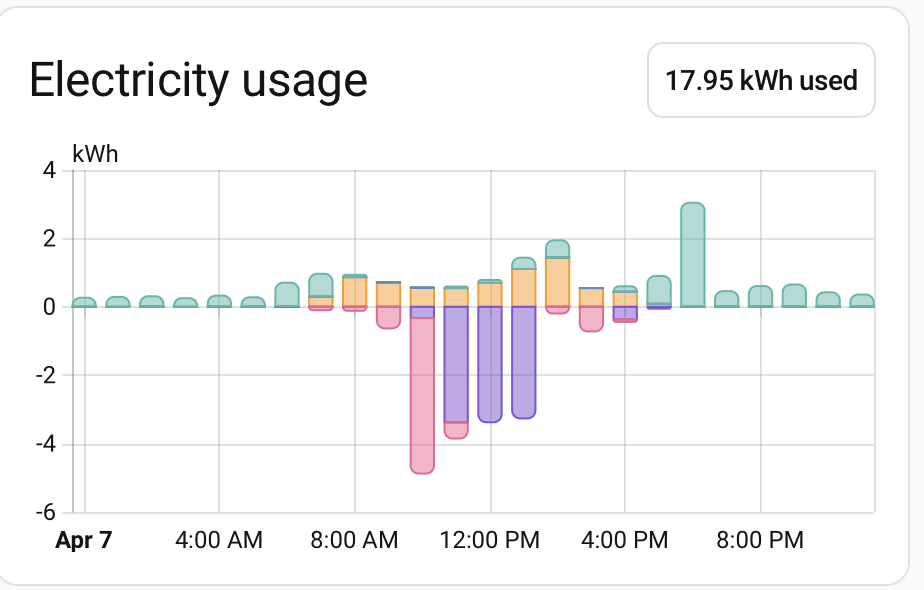
The Electricity usage pane details where we use electricity (on an hourly basis). This shows the battery charging in pink, the grid feed-in in purple. The household use from battery is in green and household use from solar in orange.
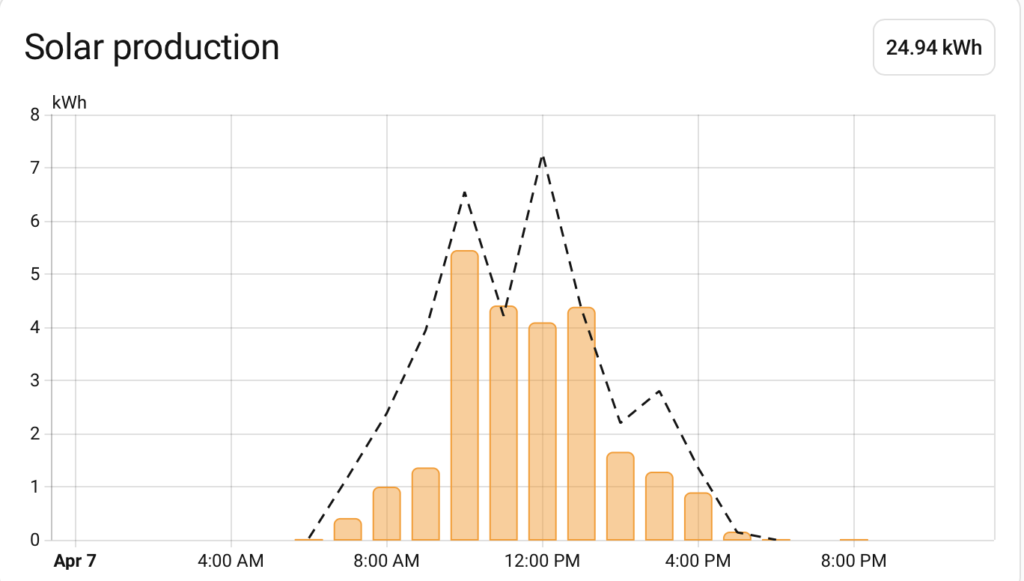
The Solar production pane gives an hour by hour look at the solar produced, and also shows the prediction for what we expected given by the solcast integration.
There is also the possibility to track more detailed use of individual devices. The summary plot looks like this.
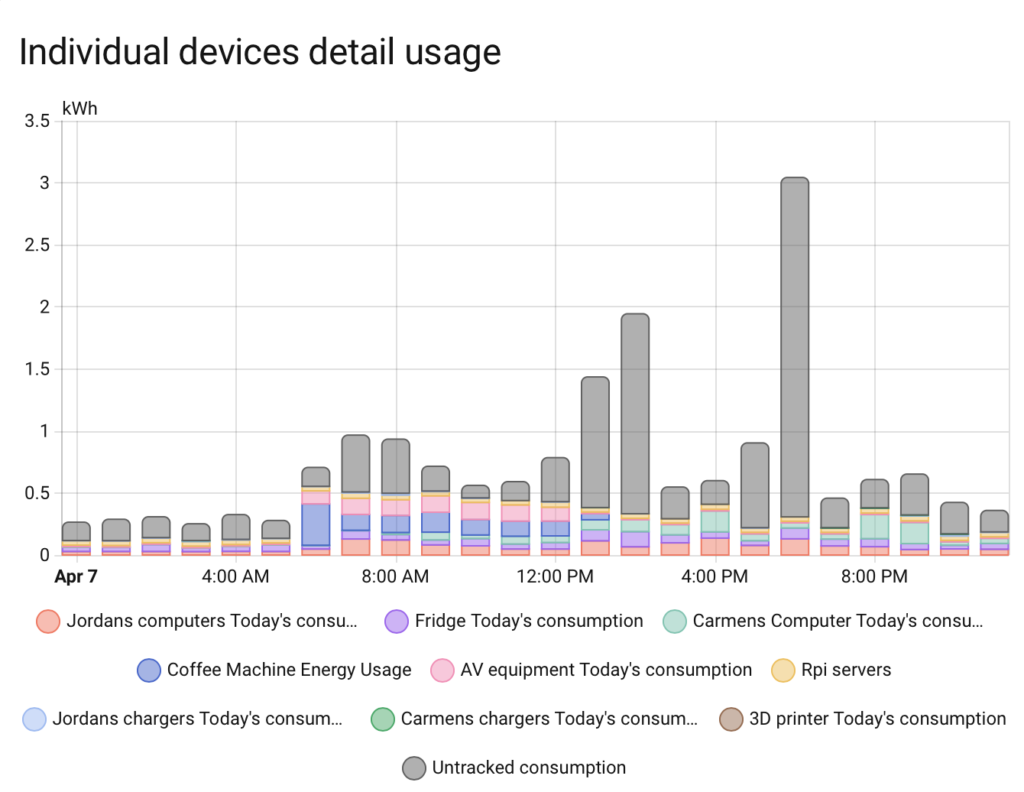
I have put in a number of devices to track electricity usage in the household. I haven’t tracked everything, there are big untracked spikes from running the washer/dryer and the oven. There was something which was really bothering me though. We are using the battery to run everything overnight, and there was a steady draw on the battery of around 250 watts overnight. I tried to find if there was a culprit for this. I’ll describe what I did to measure this, and what I found out in another post.
Leave a Reply