Working to minimise usage
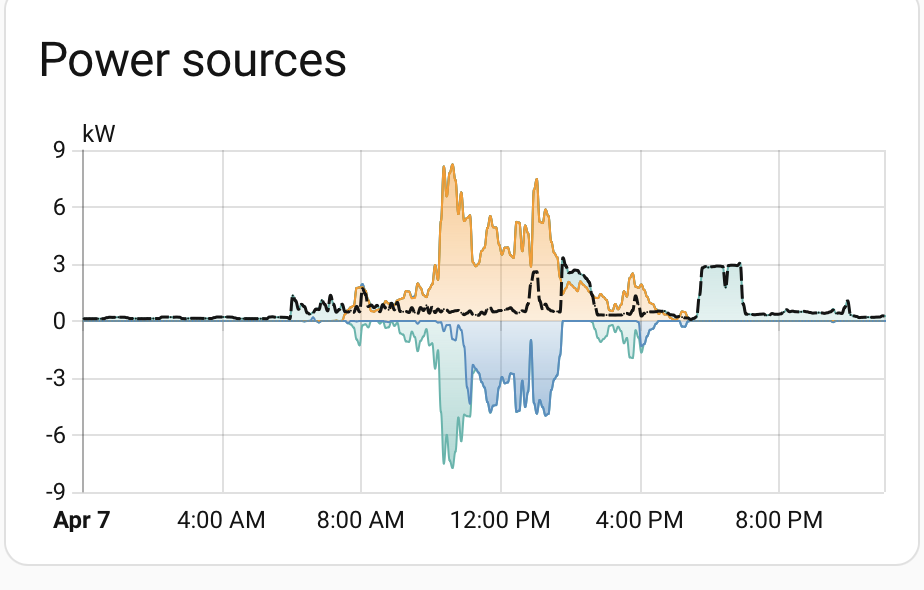
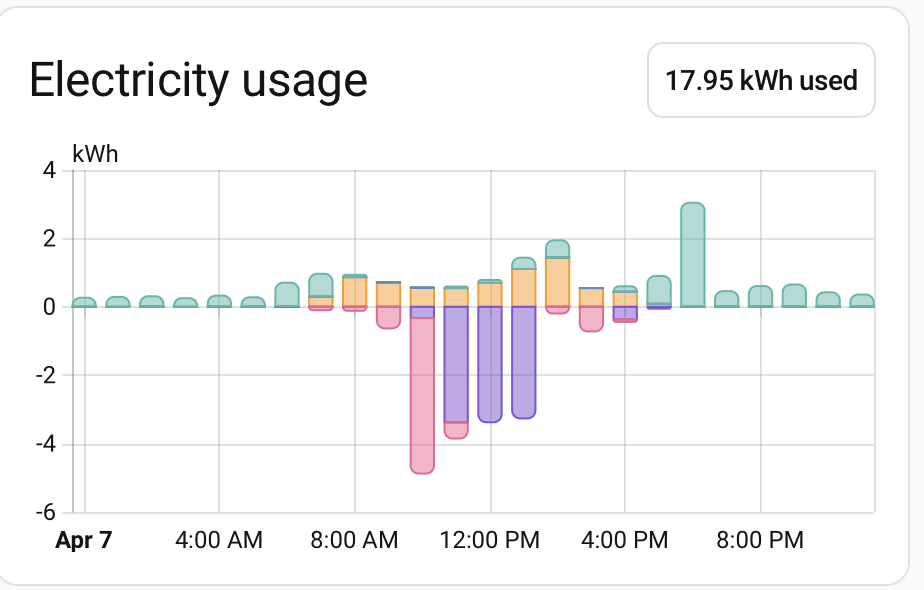
We will be using our battery to power our electric heating and so we want to minimise usage. After setting up the monitoring of energy flow in Home Assistant I noticed that we were drawing 300W-400W of energy overnight. This ends up using about 10%-15% of our battery storage.
There are a number of things in the house which we leave on overnight and draw some power. The fridge obviously, but also the wireless routers, a few raspberry pi computers and some LED lights. Looking at the sources I knew about, it still seemed like less than 400W.
Looking for the unknown usage
I have been using a couple of Shelly 1PM devices to switch on and off and monitor our coffee machine, and other appliances. These are easily integrated into home assistant and very reliable. I used one of them to monitor some of our appliances and nothing looked like a huge user of power.
I decided to try and measure everything we kept powered on at night. To do this I purchased a bunch of inexpensive Tapo smart plugs and integrated them into HA.
What the usage looks like
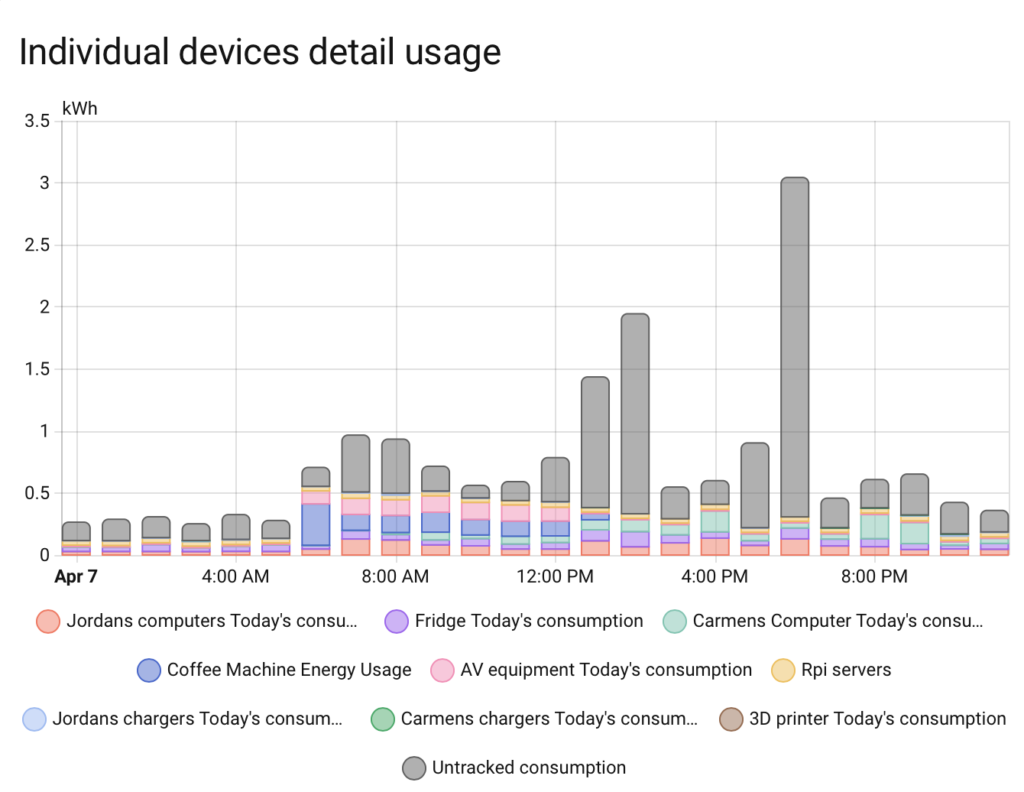
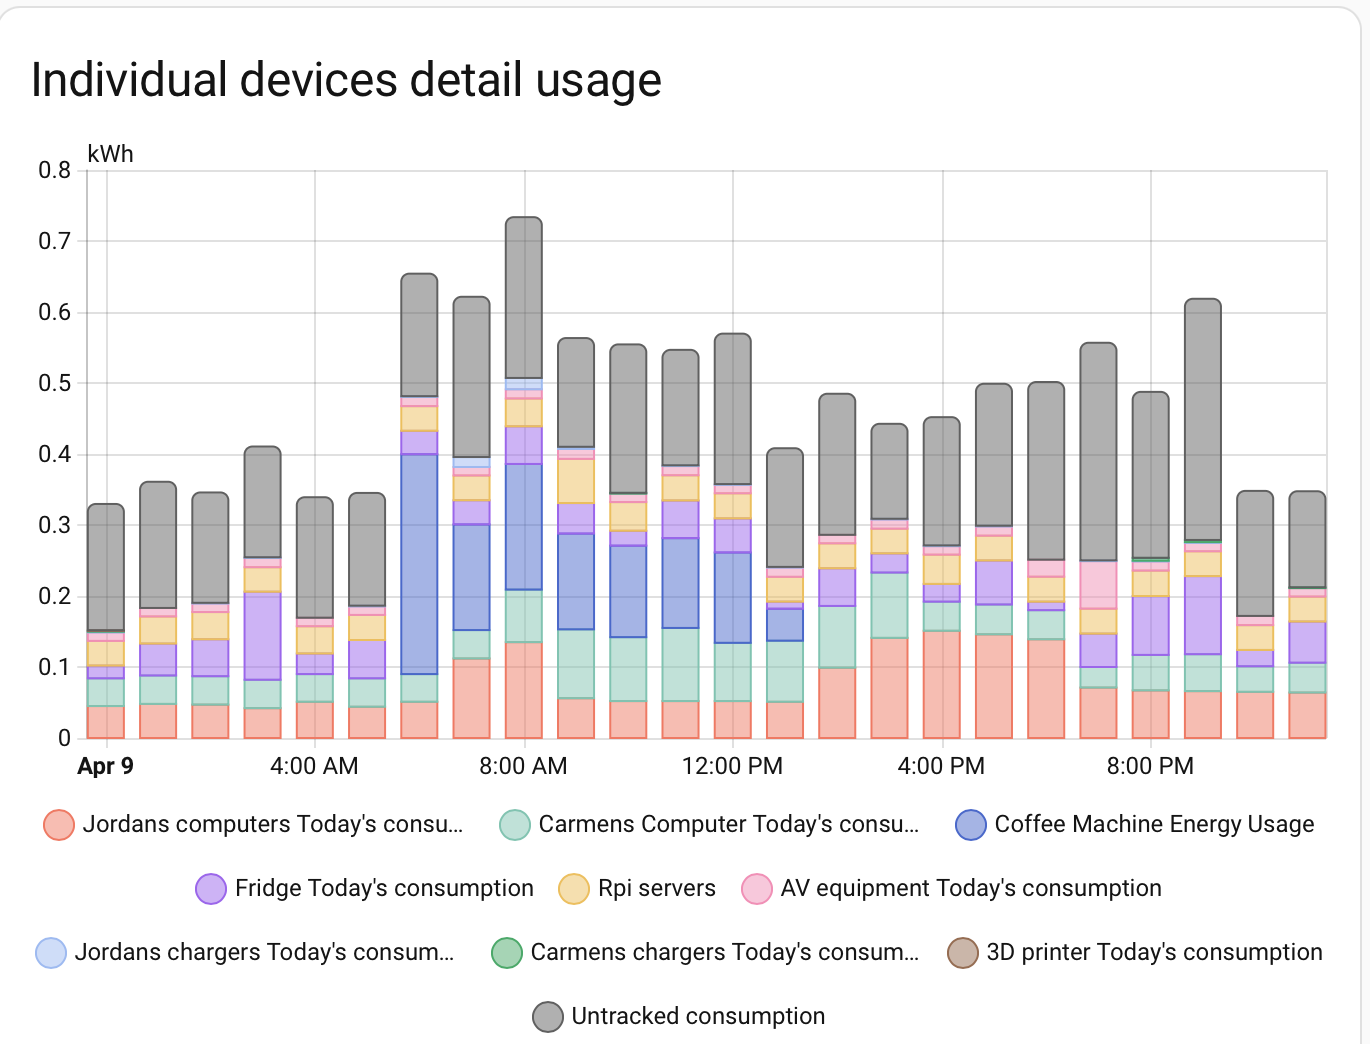
Although I don’t monitor everything I did try to assess all the usage. I checked every outlet in the house, and measured everything that was plugged into them at least once. I left the Tapos on the biggest users, and assessed that the unmeasured devices draw less than 20W. The chart below shows all the devices I measure. Dark grey is untracked consumption. During the day there are a handful of appliances I don’t measure. These include the stove, hair dryers, the kettle. I can clearly see spike in usage during the day when these are on.
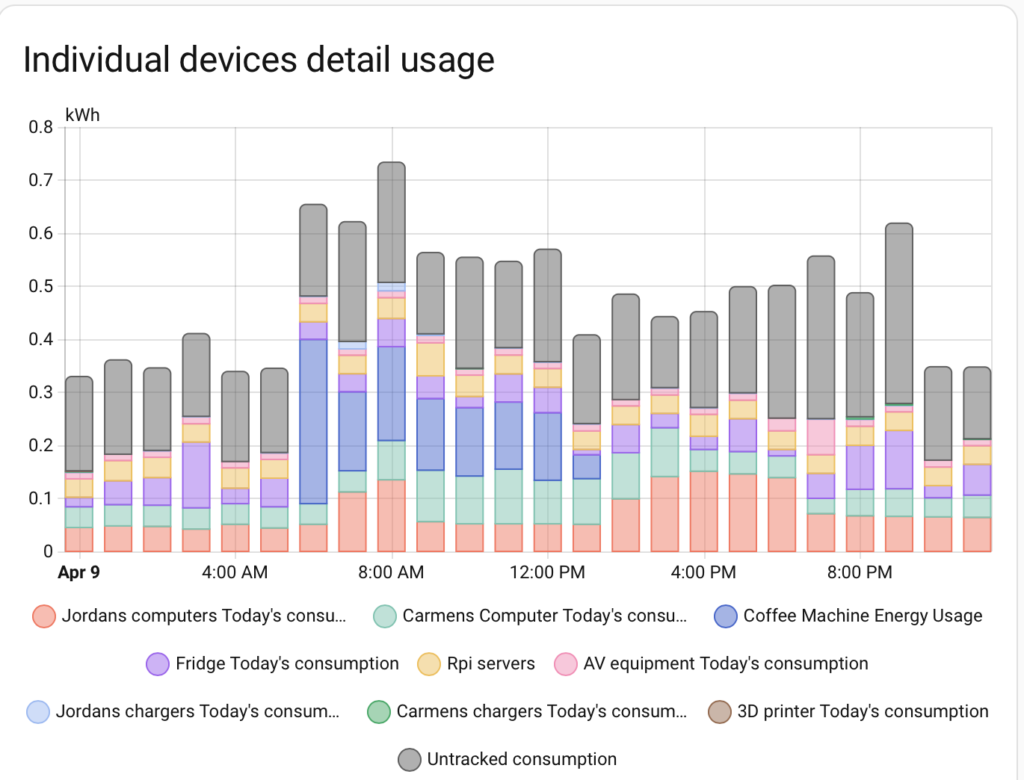
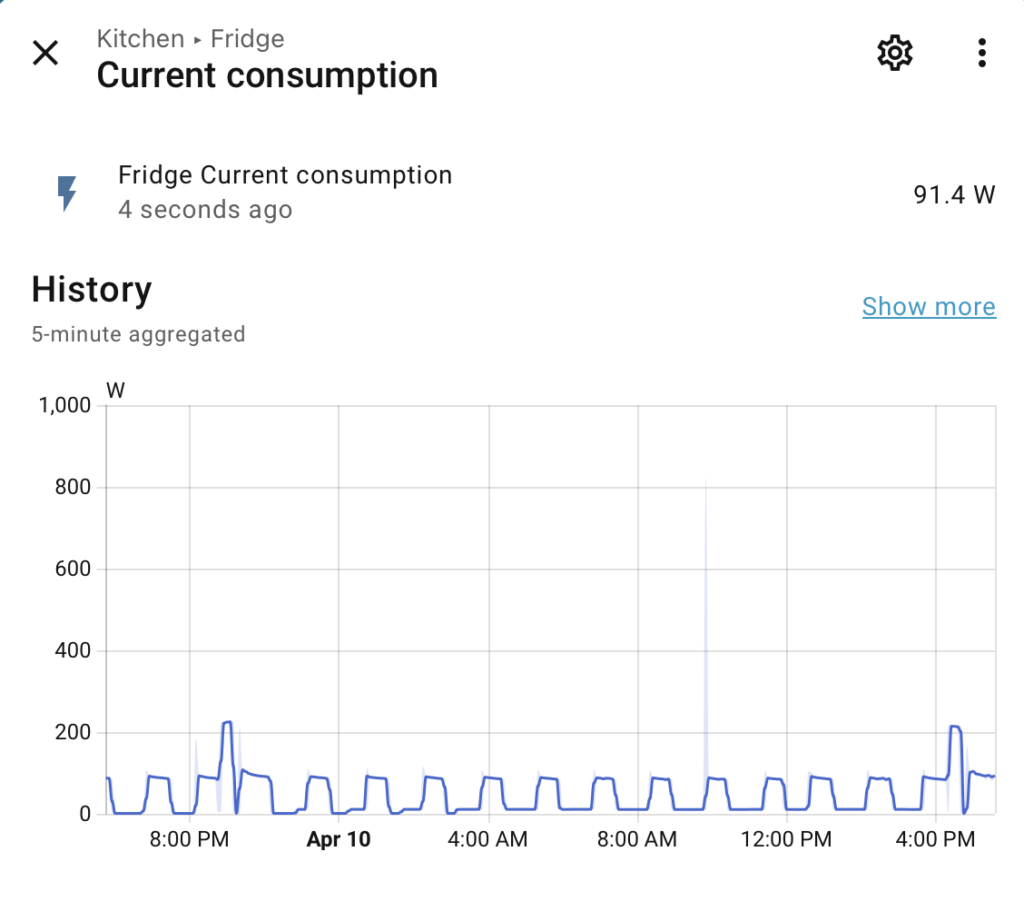
Overnight usage on the other hand is pretty steady, and only the fridge fluctuates its current draw as it cycles its cooling on and off.
Some of the servers remain on overnight, but their current draw is steady around 60 W for this group.
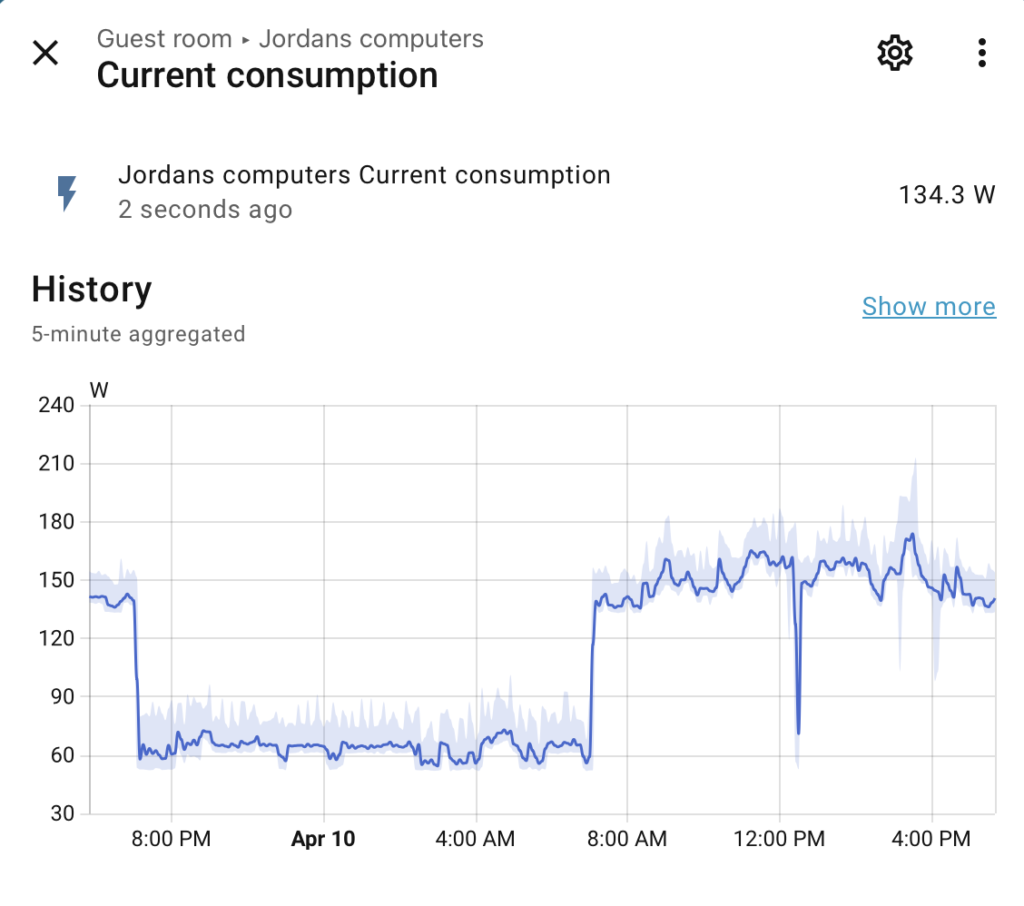
After tracking the overnight current draw for a number of nights it was clear the current draw was consistent. It was also clear that the power being used in the house was not 300W-400W. Adding up all the measured usage and also estimating the contributions for devices I not measuring the current draw at night is closer to 150W-250W.
Battery discharge does not equal power usage
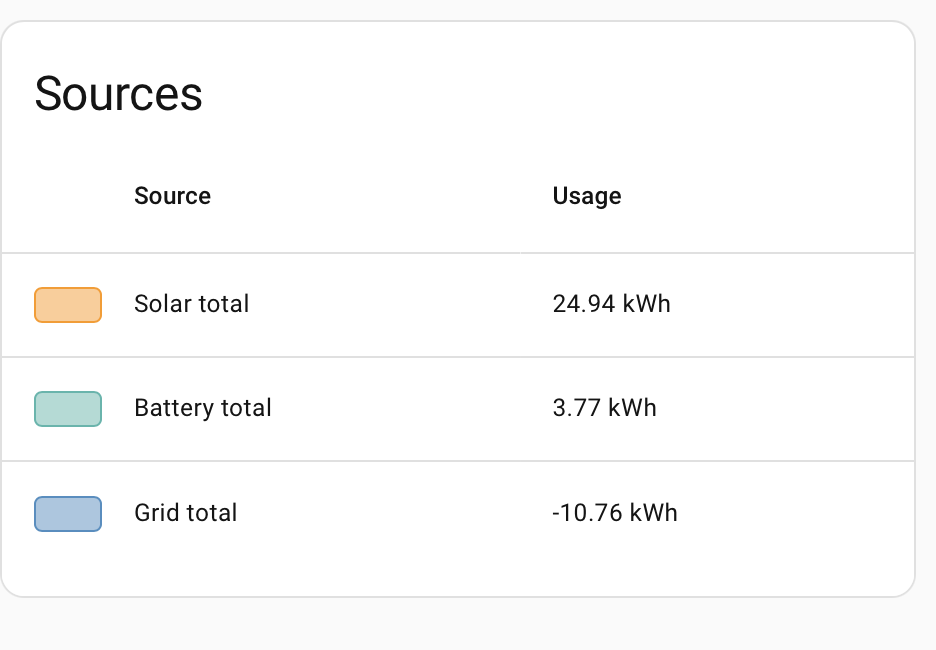
There isn’t any mysterious device hidden somewhere drawing 100W. The statistic of total energy usage in Home Assistant is essentially the battery discharge as we are not drawing from the grid. The current we draw overnight is less than the battery discharge. The most likely reason for this seems to be the inverter.
Our battery needs to convert DC to AC in order to power the house. This is quite efficient when there is a large current draw, but for small current draws it seems to be much less efficient. This seems to be responsible for most of the untracked consumption which shows up overnight in the figure above. It has been useful understanding all the appliances which do draw power, and I will need to consider whether I want to power some of them off overnight.
Closer look at overnight usage
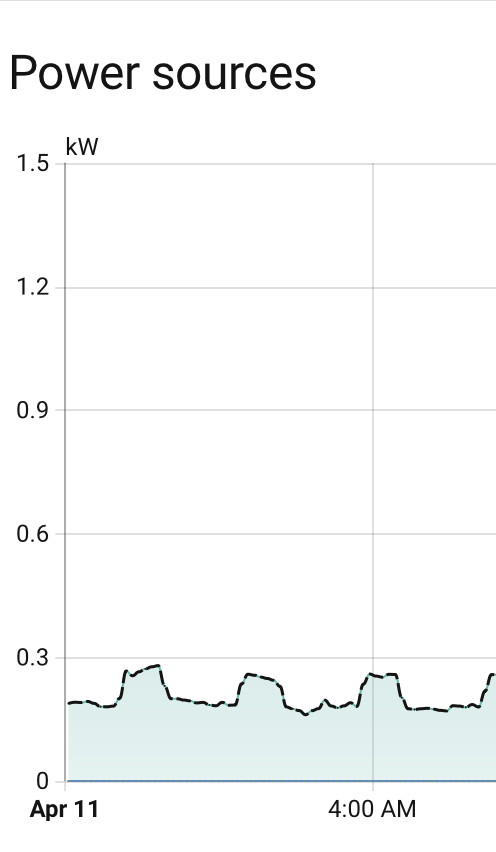
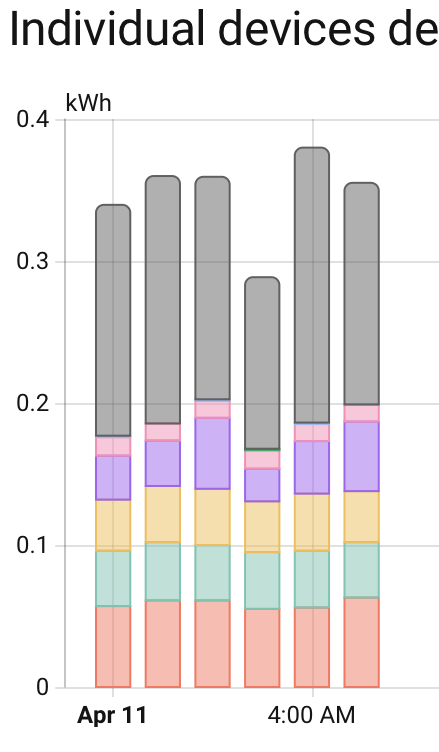
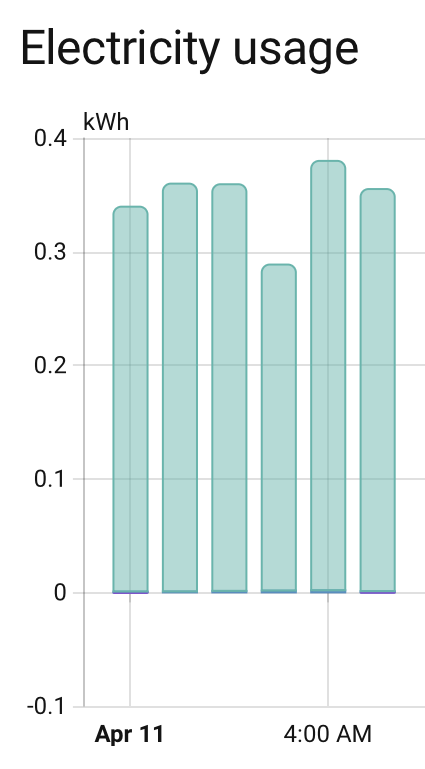
The images above on the left shows the power consumption in kW being used in the house overnight. The middle image shows all the measured energy use in the same period. The image on the right shows the measured energy being discharged from the battery to feed the household usage. The untracked (dark grey) in the middle plot is mostly coming from inverter losses.