Understanding the energy flow in our household will be critical in trying to reduce dependence on the grid. We also want to maximise our use solar energy.
Summary tab
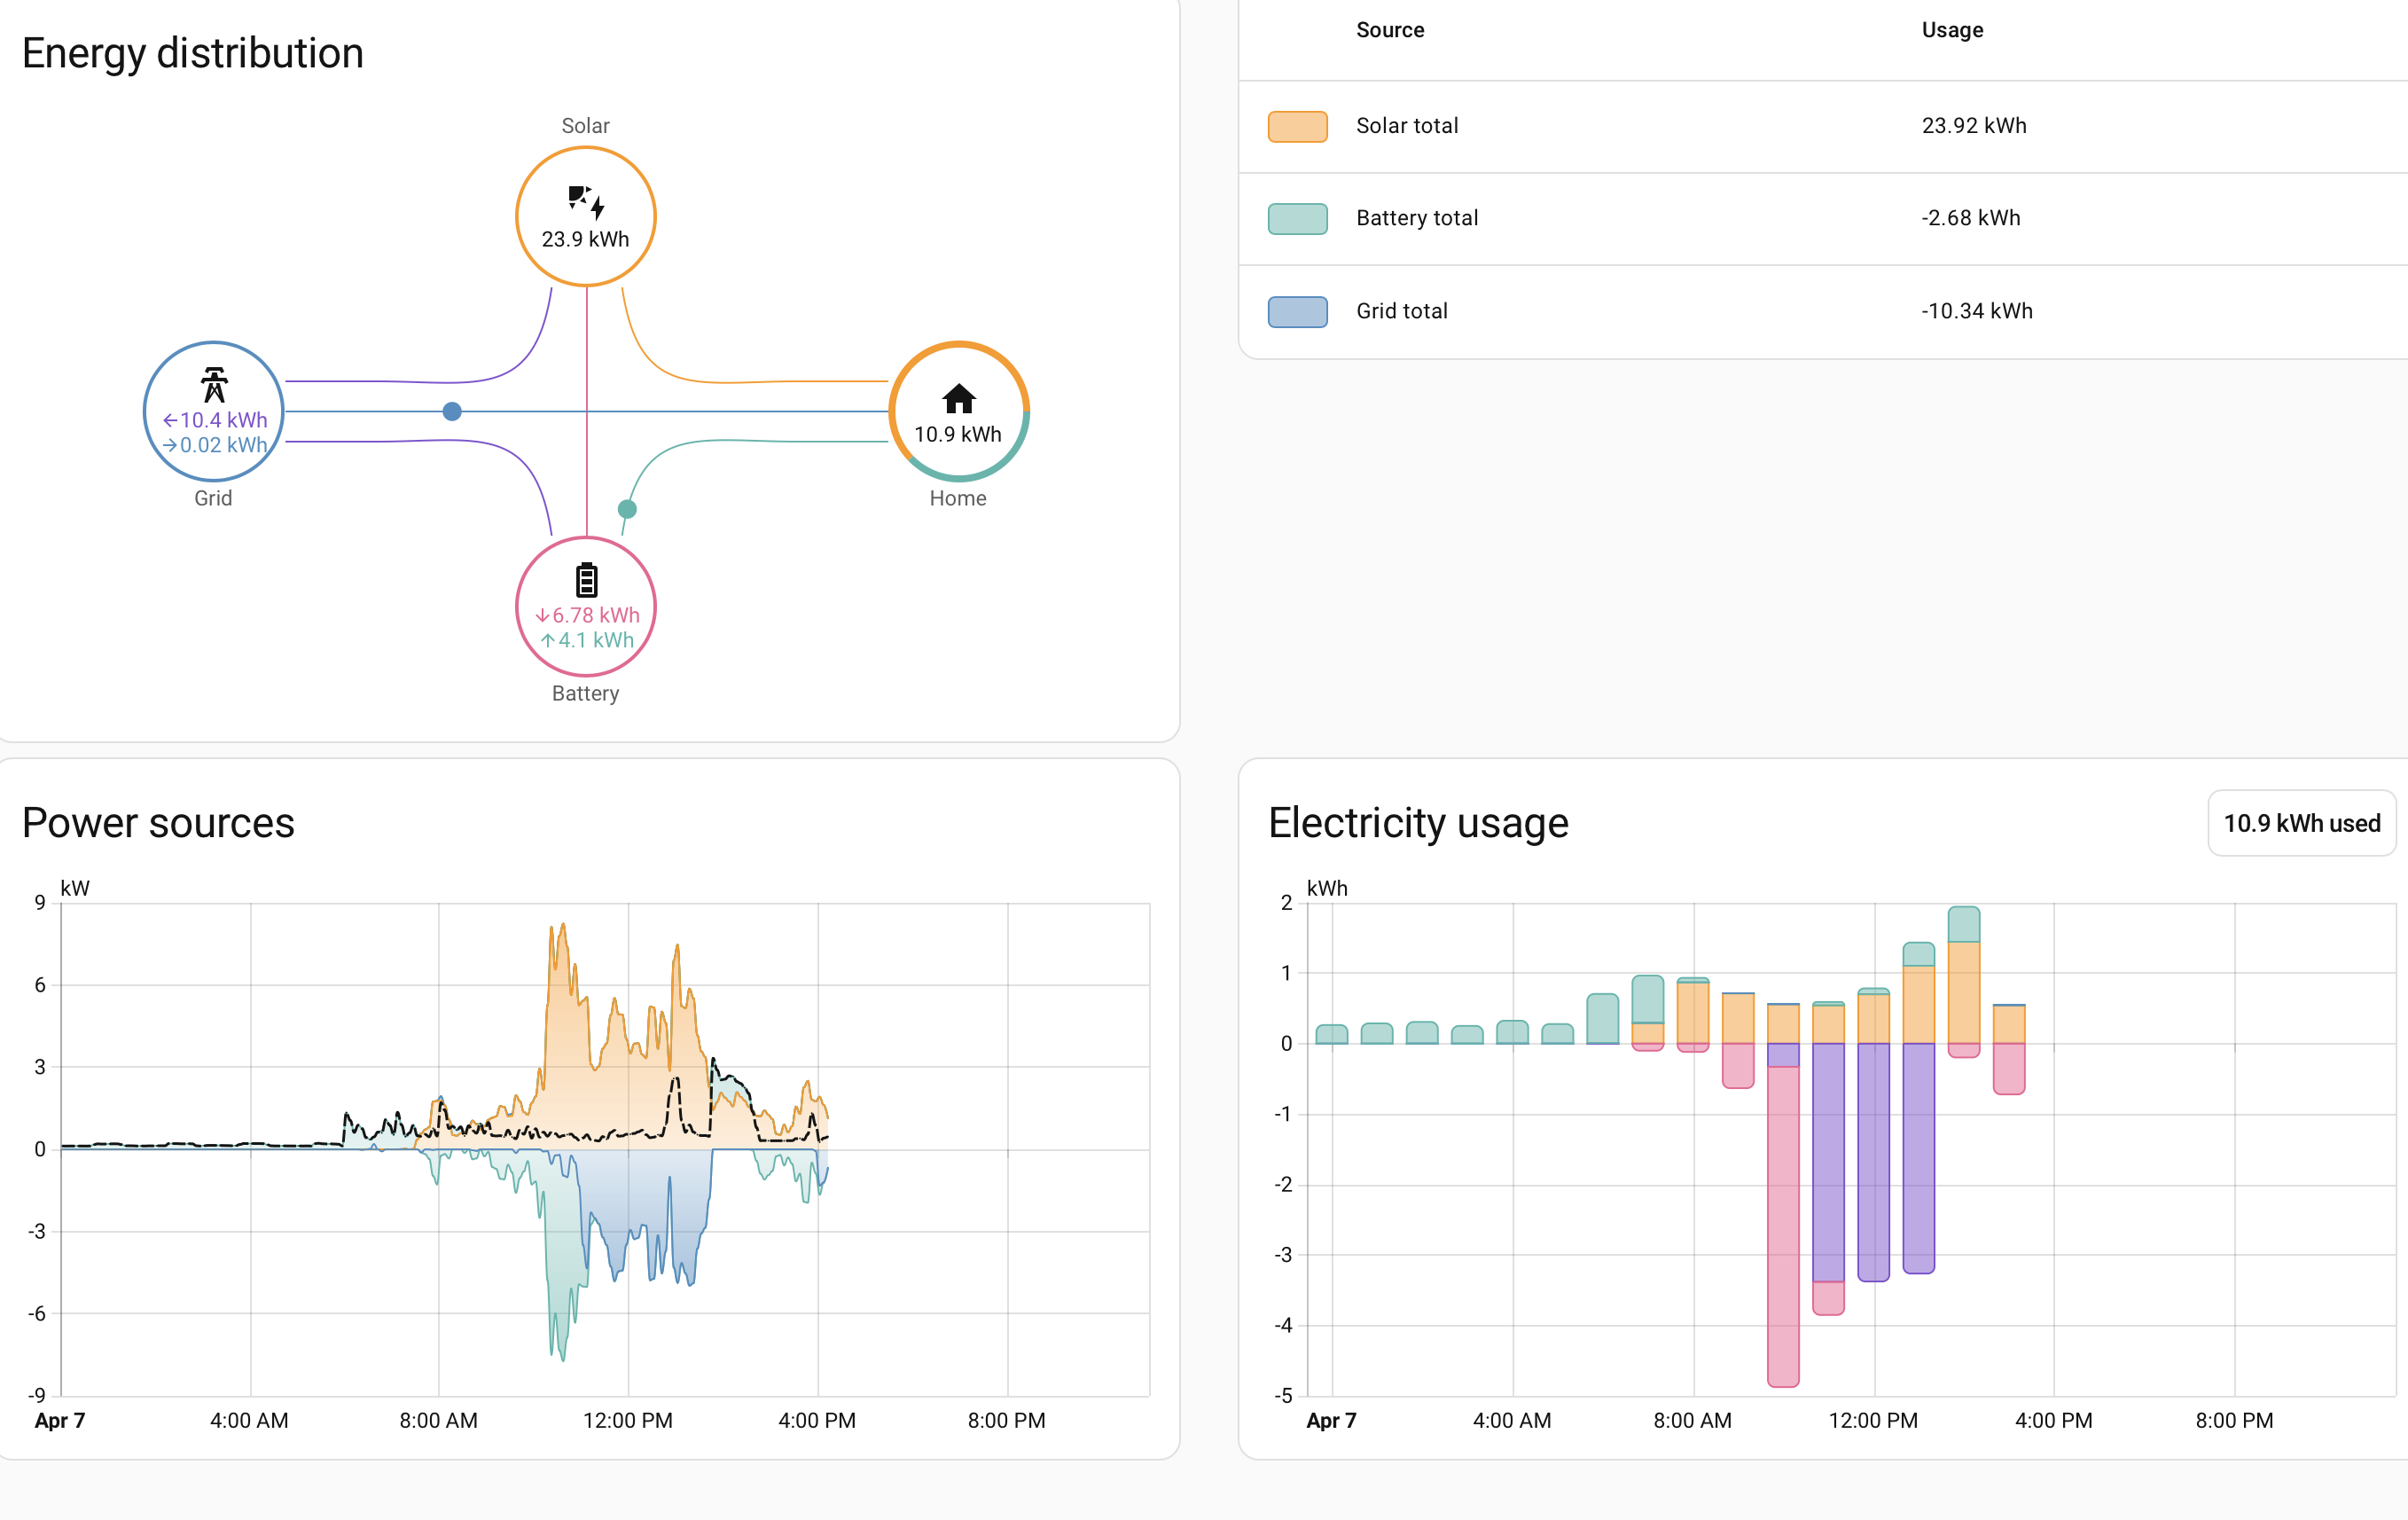
The HA Energy dashboard Summary tab provides useful overview on where and when we are producing and using energy.
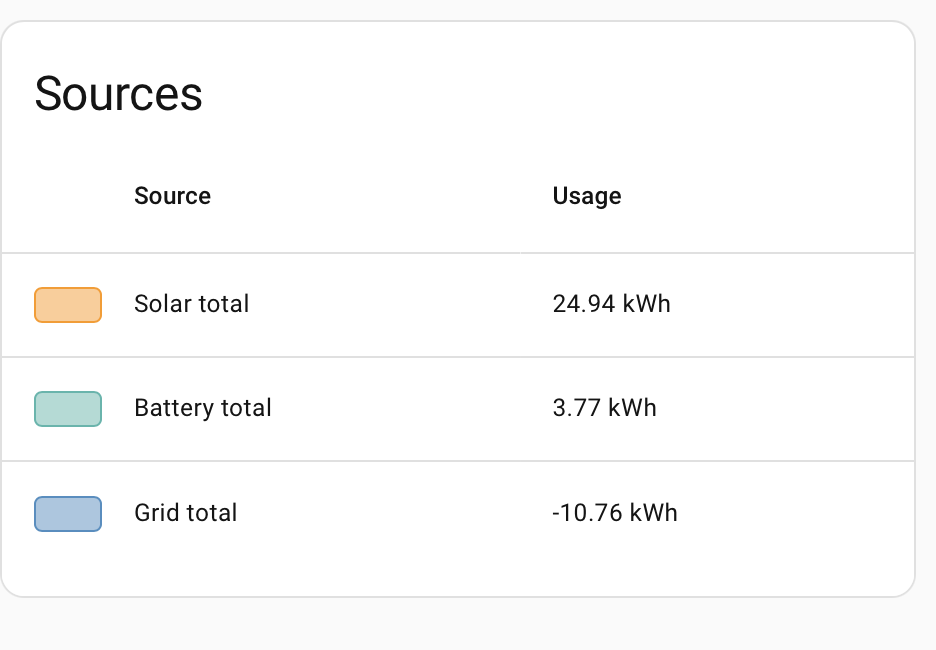
The Sources pane on the dashboard shows net usage from solar, the battery and the grid. On this day we used around 25kWh from the solar for the home and to charge the battery. We fed in the rest to the grid. Our net use of the battery was 3.77 kWh as we used more from the battery this day than usual.
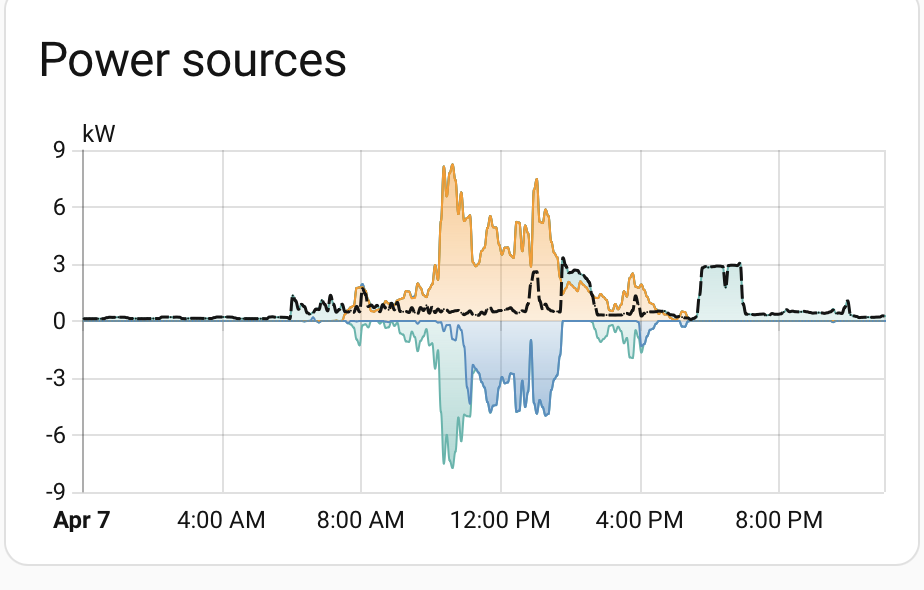
The Power sources pane shows the energy flow during the day. Here we see the battery use during the evening (cooking ) and then a small steady amount of overnight usage. During the day, the solar charges up the battery, and provides all our home’s electricity. The Solar which is left over is fed back to the grid.
Energy tab
The Energy tab in the dashboard offers a number of useful diagnostics for seeing where energy is being used and produced in more detail.
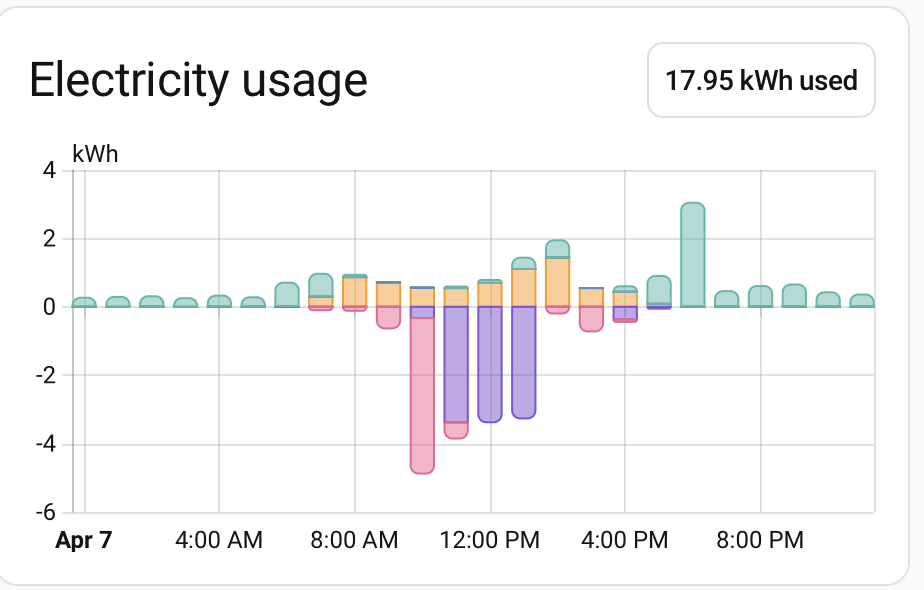
The Electricity usage pane details where we use electricity (on an hourly basis). This shows the battery charging in pink, the grid feed-in in purple. The household use from battery is in green and household use from solar in orange.
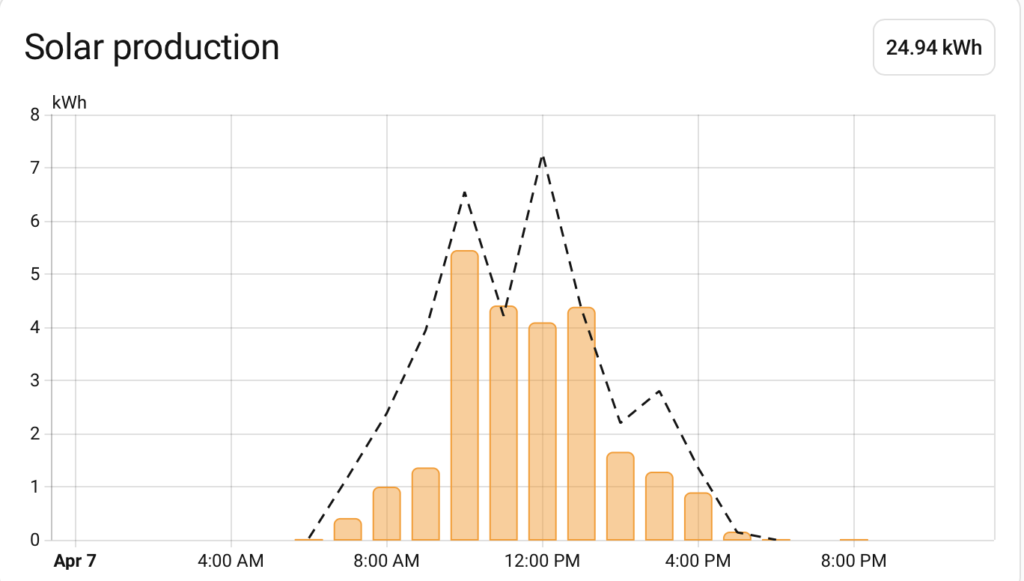
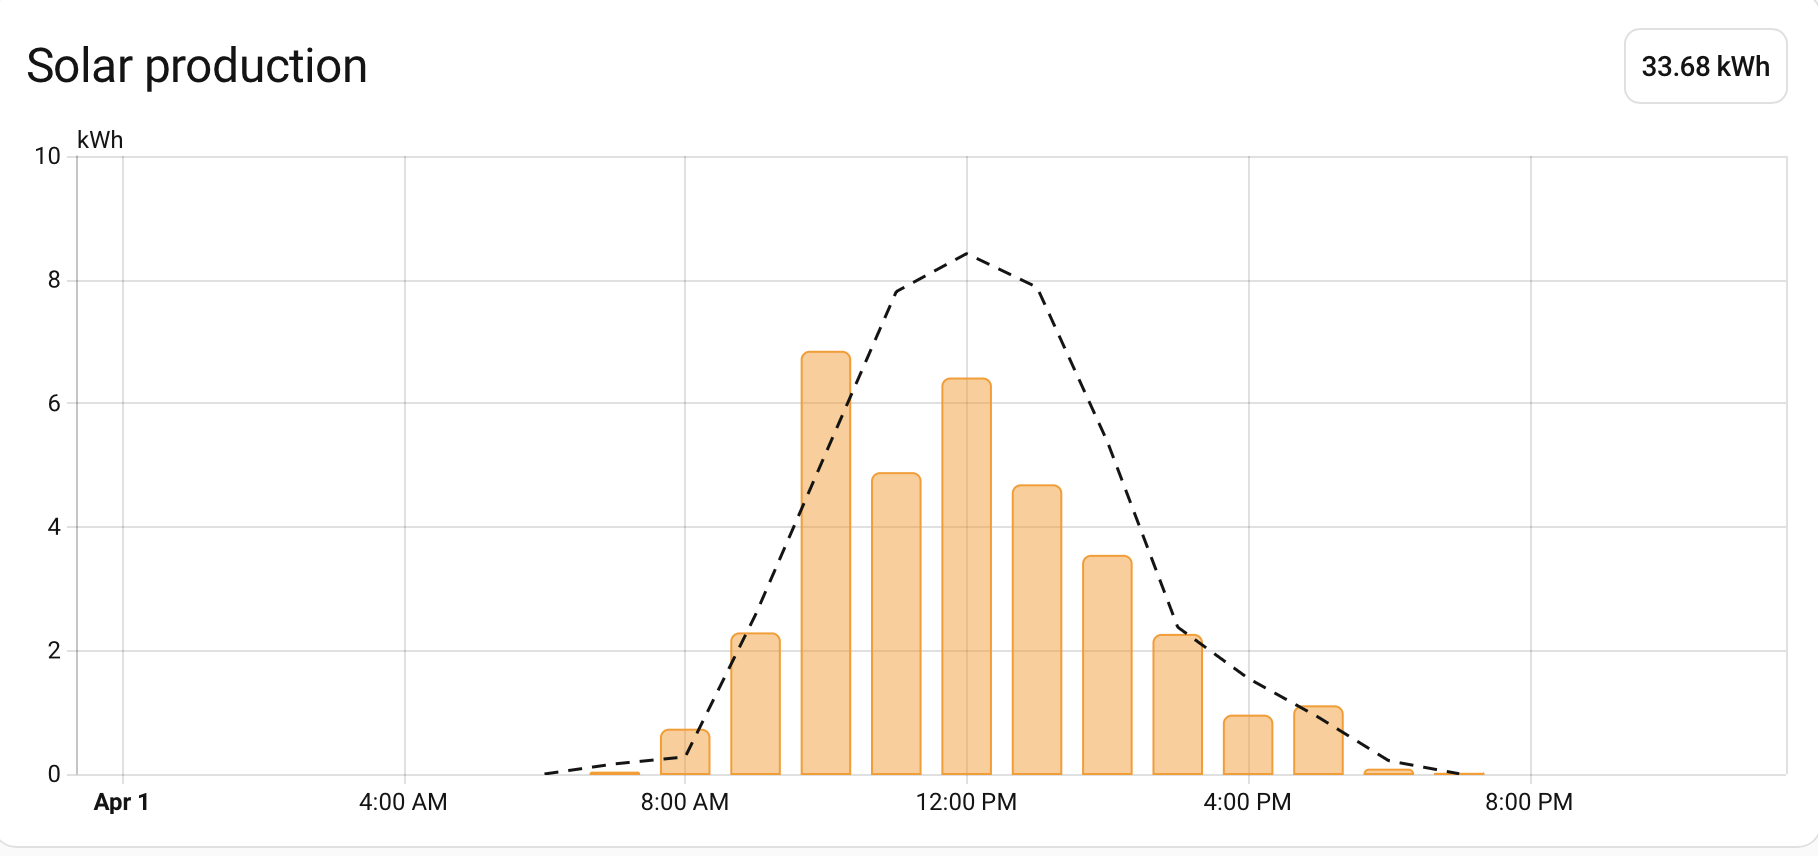
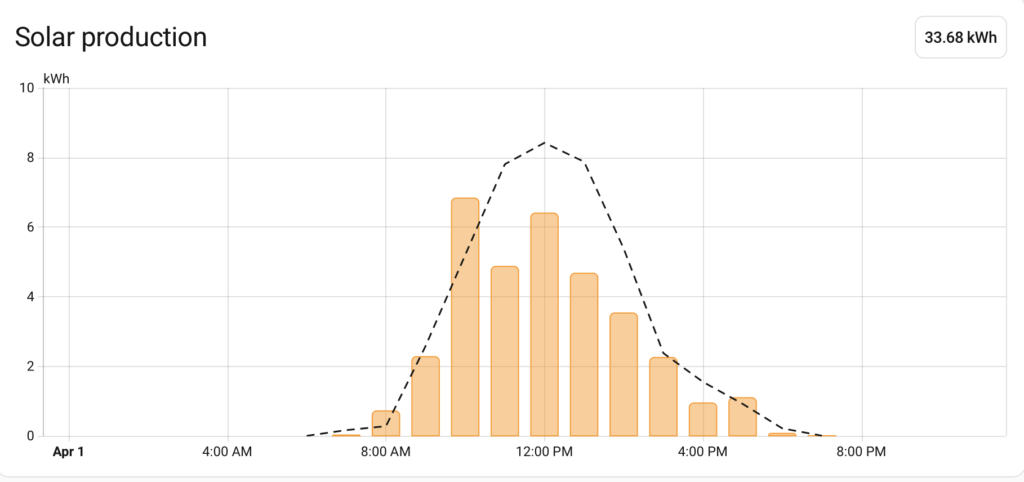
The Solar production pane gives an hour by hour look at the solar produced, and also shows the prediction for what we expected given by the solcast integration.
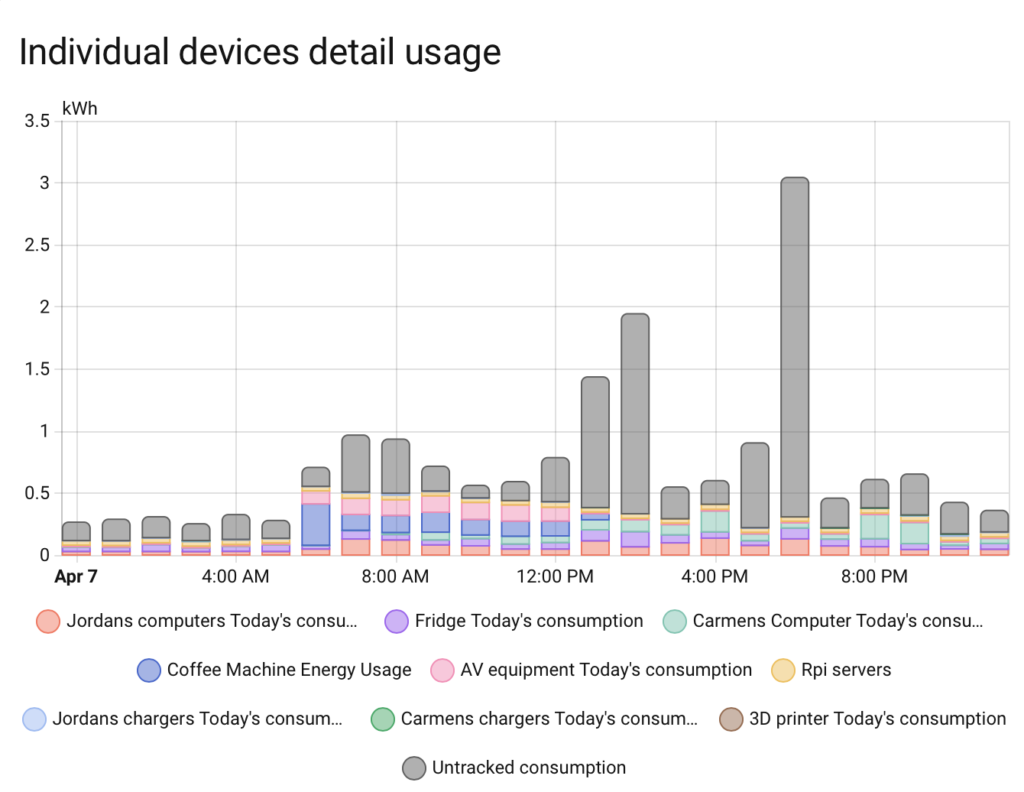
There is also the possibility to track more detailed use of individual devices. The summary plot looks like this.
I have put in a number of devices to track electricity usage in the household. I haven’t tracked everything, there are big untracked spikes from running the washer/dryer and the oven. There was something which was really bothering me though. We are using the battery to run everything overnight, and there was a steady draw on the battery of around 250 watts overnight. I tried to find if there was a culprit for this. I’ll describe what I did to measure this, and what I found out in another post.
In order to better understand how to monitor and control our appliances to take maximum advantage of available solar energy, predicting the likely solar availability is vital.
On sunny days in the summer our system could produce more than 80kWh of energy, while on a dark rainy winter day, this could be less than 10 kWh. Knowing whether there will be sun available to recharge the battery and run the heating will help planning when we need to recharge from the grid. Our supplier offers free electricity for three hours during the day, so knowing when we need to take advantage of this can be helpful
Predicting the solar energy our system will produce
In order to make an accurate solar energy prediction, we need to know a few things. Where on the planet the panels are located, how many panels and which direction they are pointing. What the weather is predicted to be for the day.
Even with this information, it is difficult to do all the calculations. Luckily there is Solcast which is a company providing this information to solar panel users around the world. They offer a free hobbyist service to anyone with home panels.
Registering for the Solcast solar prediction service
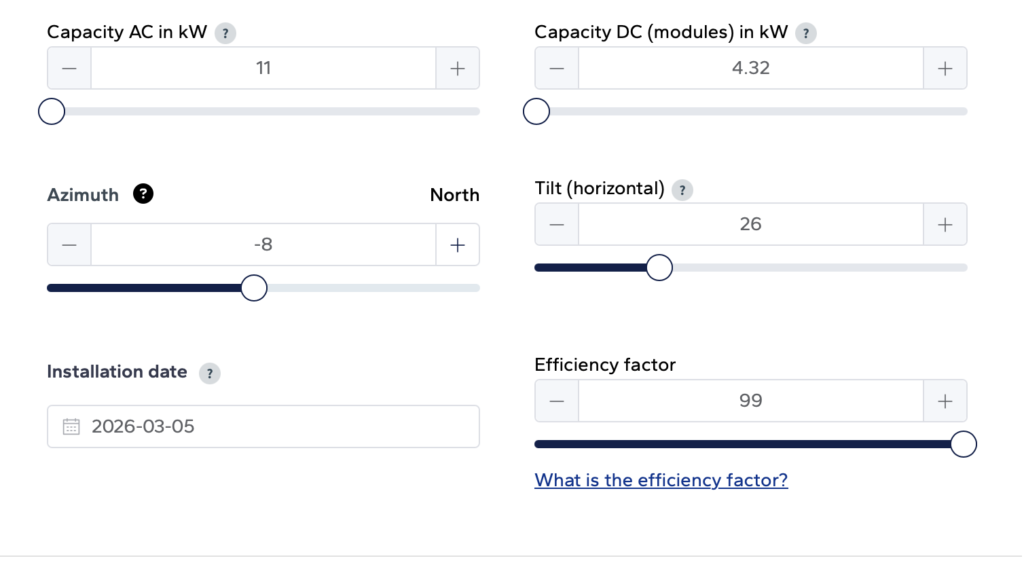
In order to register you can go to the Solcast API Toolkit and create a free account. Once you have registered, you can add a home PV system. Each account can have up to two free home PV systems. You then need to enter the location of your panels, and information about the orientation, the number of panels, the capacity and tilt of the panels.
Determining the orientation of your PV panels
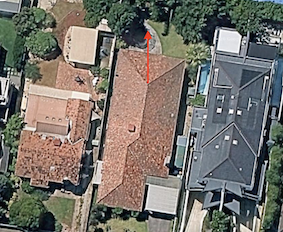
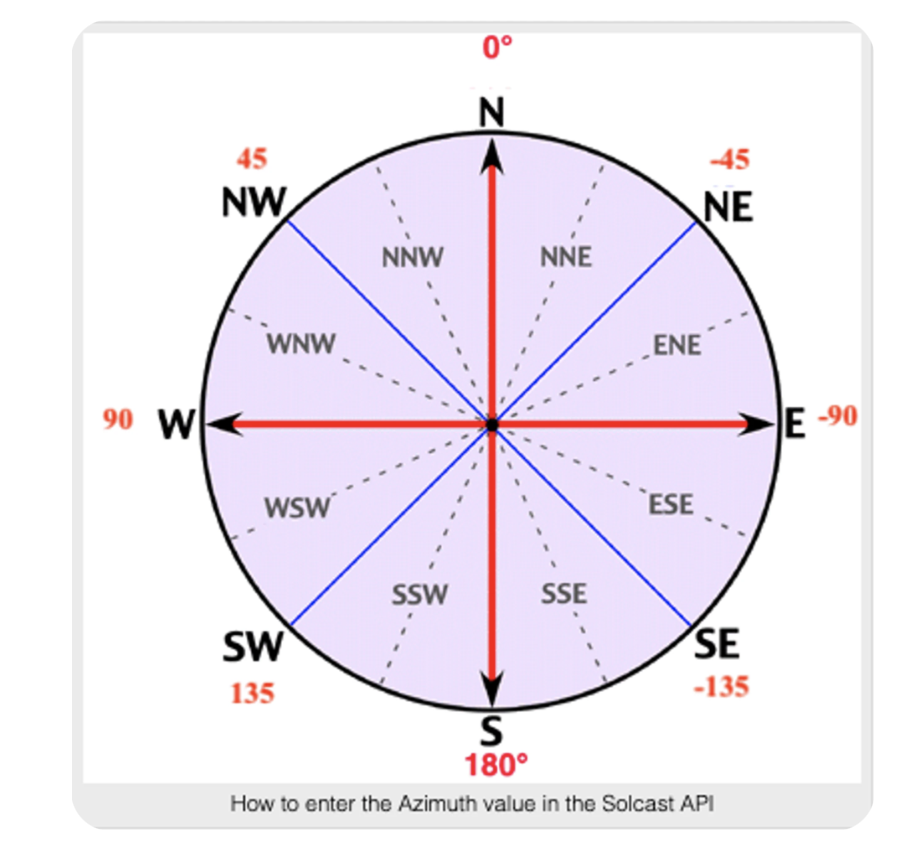
The easiest way to determine the direction your panels are oriented is to find your home on google maps, and the draw an arrow which points in the direction of your roof. In the case of Melbourne the street grid is aligned 8 degrees from true North, and the North facing panels point at -8 degrees.
Arrow pointing to true north
I measured the tilt of the tiles by using a phone app and placing it the roof aligned with the PV cells. The parameters for the system are entered as shown below.
Entering parameters for Solcast home PV system
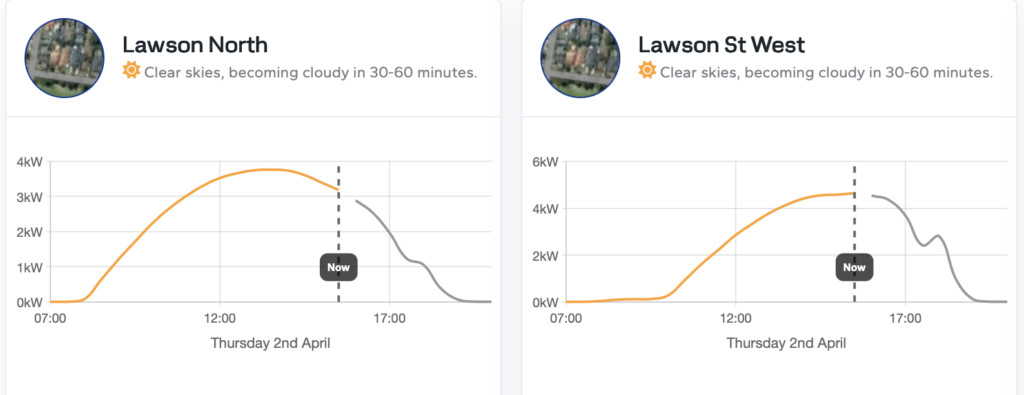
When you have entered your systems you will see a dashboard showing the actual and expected solar energy your panels should produce for today, and a prediction for the next few days.
Dealing with multiple PV strings
Our solar installation has panels facing three orientations. Solcast limits the free PV models for each account to two systems. If you have more than two, you can create an average over two or more of the PV strings to give an approximation. Otherwise you will need to have another account to model the extra strings. The integration for Solcast in Home Assistant can deal with this.
Adding the Solcast solar prediction data to Home Assistant
There is a HACS integration for Home Assistant which neatly brings the data in from your Solcast model. You can find it at ha-solcast-solar, and add it in the usual way you add HACS integrations.
This integration asks you to add information about your model, including the API key. You can add multiple strings of PVs when you are setting up the integration.
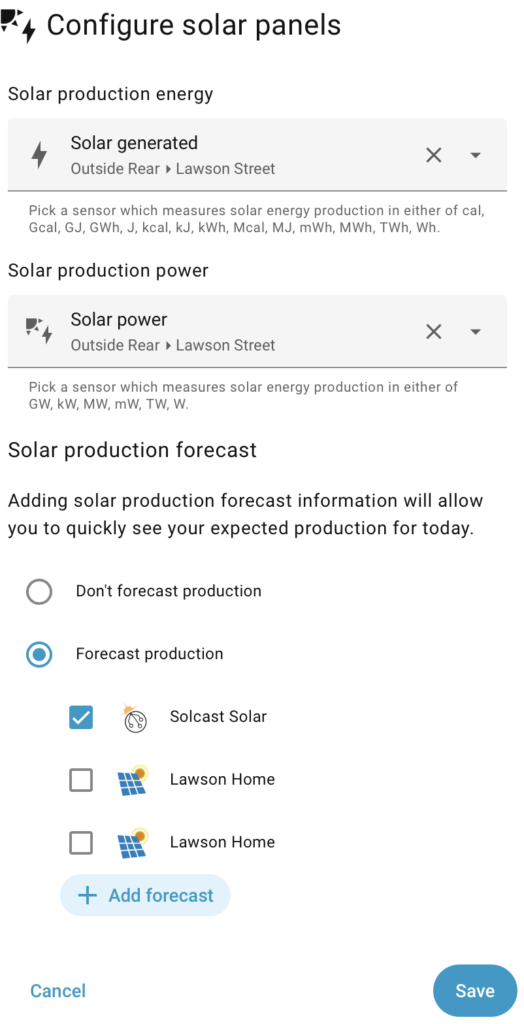
You then need to add this on the Energy Dashboard of Home Assistant. This is done in the Solar Panels section of the dashboard. You will need to edit the solar generated item you added previously (Using home assistant for monitoring battery and solar) and you will have the option of adding the solcast forecast.
When you have added the forecast, the Energy Dashboard will now show both the prediction (dotted black line) and the measured solar power from your panels.
Solcast prediction and measured solar production in Home Assistant
We have been using home assistant for monitoring and controlling many items in our home for a few years. This is a fantastic open source home automation system, and is ideal for monitoring energy usage. It can also be used for controlling use and charging of a battery taking into account tariffs, solar input. We also plan to use it to monitor and control the HVAC system and the hot water heat pump.
We considered a number of different solutions for battery storage, and decided to go with a Tesla Powerwall 3 solution. This is a mature and well tested system, even if we had some worries about the CEO. Our system has two Powerwalls giving 27.5 kWh of storage along with a gateway. This setup gives us whole home backup, and the inverter is built into the Powerwall.
Home assistant has a pretty good setup for monitoring energy usage documented at HA energy dashboard. The dashboard needs to be able to read out the information from the inverter, battery, grid usage, and solar production. Many battery and inverter systems are able to be integrated with home assistant in a straightforward manor. The Tesla Powerwall app which allows the user to control and readout the battery is a little more locked down.
Getting access to the Powerwall data
There are however several ways to get this data into home assistant.
Locally read the data by connecting to the wifi which is on the Powerwall.
Access Tesla’s developer API.
Use a paid third party solution to access the Tesla API and get up and running quickly.
I explored, and managed to get all three of these options working, but in the end I am using the third option with my HA setup. It works flawlessly, is quite affordable, and prepares all the sensors needed to setup the energy dashboard in home assistant. The downsides of this approach are that it depends on access to the Tesla cloud, and costs a small amount of money.
If you are interested in either of the first two options, I recommend having a look at the excellent pypowerwall python library https://github.com/jasonacox/pypowerwall. This has code to access the data provided by the battery. There is also a wealth of information about how to connect to either the local wifi or the cloud.
If you want to connect to the local wifi, be sure to take a photo of the inside of the Powerwall when it is being installed. There is a sticker in there which has the SSID : (something like TeslaPW_XXXXXX) and Password on it which you will need to connect to the wifi. You can connect a computer to this wifi, and then can use the TEDAPI in pypowerwall to access the local data from your battery. This gives access to information like the power on each string of PV panels.
The quick solution – using Teslemetry
There are a lot of complications in getting this data into home assistant, but if you have enough IT skills it is doable. If you want to connect to the Tesla API without paying, you need to register on the Tesla portal (https://developer.tesla.com). This allows you to make calls and get information about your battery without paying. Again, if you have sufficient IT skills, you can do this. I set up an account, and managed to make the API calls, but opted for the easier solution in the end.
Using the Telslemetry solution https://teslemetry.com makes it incredibly easy to integrate the data from the battery into home assistant, and costs only a few dollars a month. In the end it was worth it to subscribe, and be up and running reliably and immediately rather than spending a lot of time rolling my own solution.
After subscribing to Teslemetry, and adding the integration into home assistant, I was able to setup the home assistant energy monitoring with the sensors defined by Teslemetry.
Setting up the Home Assistant energy dashboard
When you setup your Powerwall with the Tesla app, you give the system a name. You will need to edit the energy dashboard in HA, and enter 6 sensors. The sensors which are available and wher to enter them in the dashboard are (for a:
My system Grid Imported (add to Electricity Grid/Grid Consumption)
My system Grid Exported (add to Electricity Grid/Return to Grid)
My system Grid Power (add to Electricity Grid/Grid Power)
My system Battery Charged (Home battery storage/Battery systems)
My system Battery discharged (Home battery storage/Battery systems)
My system Solar generated (Solar panels/ Solar production)
After doing this, there is lots of information provided by the energy dashboard in home assistant.
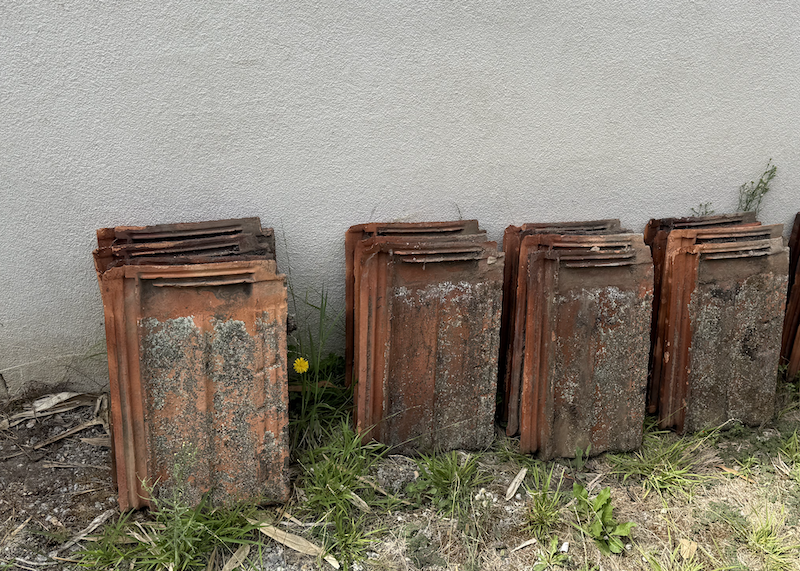
Our home has a terracotta tile roof. This is one of the more challenging surfaces for solar panel installation. We were quite careful about choosing our installer, and went with a local company on the recommendation of someone who had used them in the past. We discussed with them the challenges of installation, and they asked us to source some replacement tiles in case of any breakage. Although they work carefully to avoid breaking any roof tiles, terracotta can be brittle, and so we sourced around 25 spare tiles.
Spare tiles
The tiles on our roof were made by a company in Ballarat which went out of business some time ago, so we had to source spares from a salvage company. Luckily these were fairly common in Melbourne homes in the past, and there was no difficulty in finding spares.
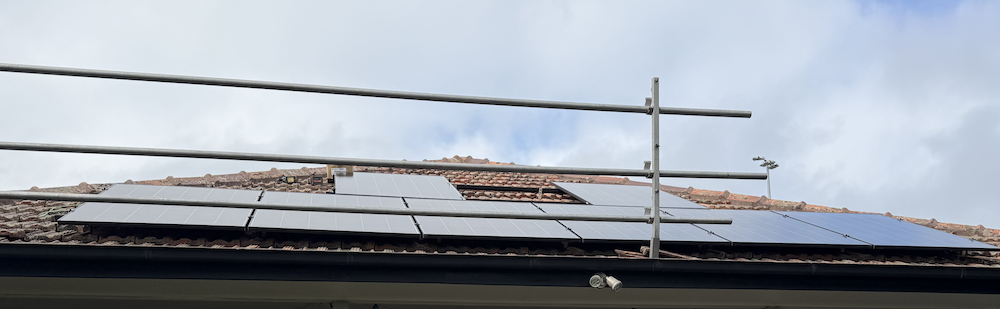
PV installation on North facing roof
Panel installation
Our solar panel installation took place over two days. The installers mounted the panels on the first day. They also finished much of the electrical work on the panels, switchboard. They finished installing the battery on the second day. The above picture shows our North facing roof with 8 of the 9 tiles in place. Our system has 8 tiles facing East, 9 on the North facing roof, and 13 on the West facing roof.
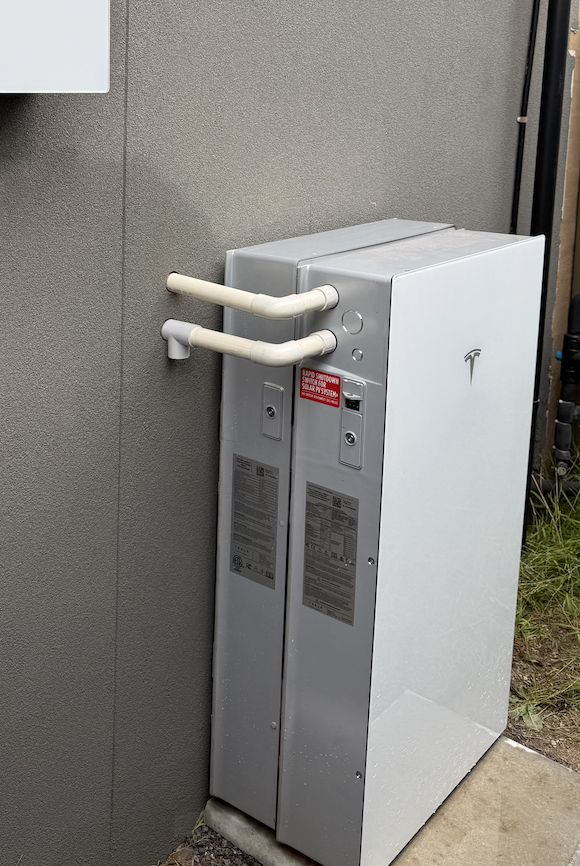
Battery installation
Battery installation
We situated the battery outside on or West facing wall. It is in a shaded area, and not far from the switchboard which is inside the house. In the end we opted for a Tesla Powerwall 3, giving a bit over 27 kWh of storage.
At the end of the second day, the system was operational, and the installer showed us how to use the application for the battery to operate the system.
The installers were careful and only 3 tiles were broken and replaced. The next time it rained we discovered that a fourth tile had cracked, but the crack was not visible as it was in the area where the tiles overlap. It rained heavily, and we heard water dripping in the roof, so we called the installers who came out the next day, and discovered the culprit.
Our goal for our home is to move completely off of gas and onto electricity and we need the solar system size to be adequate for the task . When we started, we were not heavy users of electricity, using 10-15 kWh per day, with our biggest uses coming from household appliances (washer, dryer, fridge, oven). We had gas for ducted heating, hot water, and stove top. Although the bills for gas were seasonal they were larger on an annual basis.
When considering how large a solar/battery system we wanted to install, we wanted to be able to avoid drawing from the grid as much as possible once we replaced our gas appliances, but were realistic about not sizing the system too large. We also want to be able to charge an EV in the future, so that motivated putting in a reasonably large number of panels to be able to power the house and also charge the car using solar as much as possible.
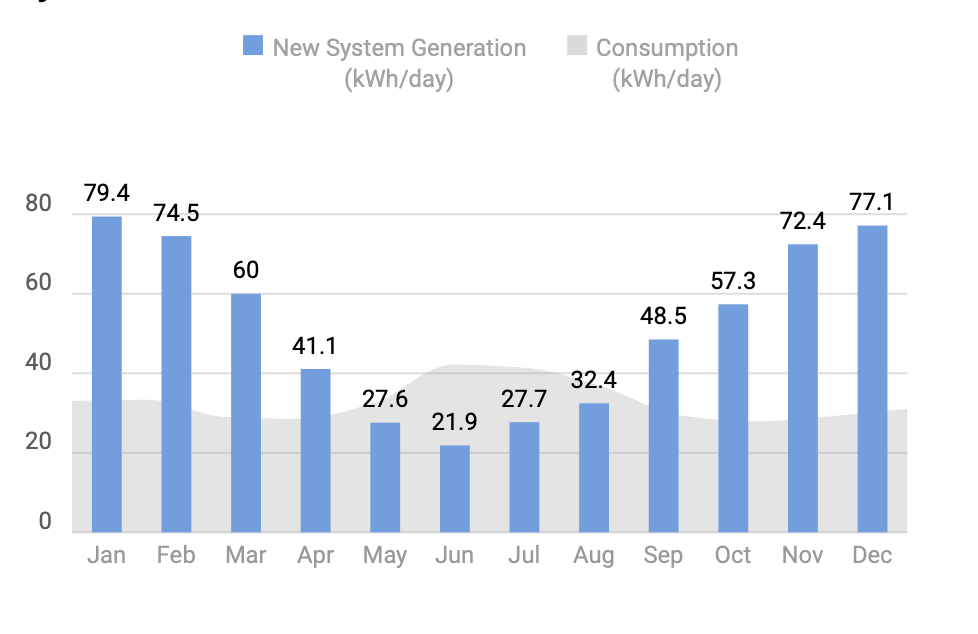
We asked the solar provide to help size a system for us and they provided the model shown below
Proposed solar system size
The system they proposed had 30 PV panels (480 W each) placed on three of our home roof surfaces (E-8/W-13/N-9) and 27kWh of battery storage. The plot shows a model of our energy usage with heating and cooling and hot water moved to electricity in grey, and the average expected daily solar output in blue.
As feed-in tariffs are now essentially 0 in Victoria, there was no financial incentive to overproduce solar for feed-in, however this leaves a lot of potential to charge an EV for much of the year using only solar. This works for us as we often leave a car parked at home in the day and commute by bicycle. This size system also deals with the very large difference in solar production and energy usage in Melbourne throughout the year. Our largest electricity use for the home will be in winter (air conditioning is not really something we need very often) and that is when solar production is at a minimum.
The battery will allow us to time-shift electricity production from the day to the evening/morning when we need the heating, and also allow us to heat the house during the day which is something we have not really done with gas heating due to the expense.