Category: Home Assistant

  • My Home Assistant setup

    My Home Assistant setup

    There are several ways to setup Home Assistant. It can run on a dedicated machine for example raspberry pi with the Home Assistant Operating System (HAOS). HA can also be run in a container environment on any pic you might have around. See setting up home assistant for more details.

    I had an 12 year old iMac which had its hard drive die. I set it up to boot into Ubuntu from an external SSD. This machine has enough power to run various tasks I need from Ubuntu. It can also to run Docker allowing HA to run in containers.

    Home assistant docker setup

    Home assistant has a docker container available which you can use to run it. However it takes a bit more work and add-ons to be set up in separate containers.

    I use a docker-compose.yml file to launch all the containers I need – at the moment, I have

    1. Home Asisstant
    2. mariadb as the database for HA
    3. mosquitto for MQTT. This is using a shared network so that I can send MQTT data from another container I start separately.
    4. zwavejs for zwave
    5. phpmyadmin – to keep an eye on the database
    6. nginx – to be able to login remotely to my HA setup

    You won’t need all these to get started, probably just HA and mariadb would be a good place to start. I’m documenting other services to give an idea of the level of technical know needed to use docker instead of the HAOS.

    The docker-compose file to start all these services looks like this

    # docker-compose.yml
    services:
      homeassistant:
        container_name: homeassistant
        image: "ghcr.io/home-assistant/home-assistant:stable"
        volumes:
          - /home/Documents/home_assistant/my_local_config:/config
          - /etc/localtime:/etc/localtime:ro
          - /run/dbus:/run/dbus:ro
    
        restart: unless-stopped
        privileged: true
        network_mode: host
        depends_on:
          - mariadb
        stdin_open: true
        tty: true
    
    
      mariadb:
        image: mariadb:latest
        container_name: mariadb
        restart: always
        environment:
          MYSQL_ROOT_PASSWORD: "${MYSQL_ROOT_PASSWORD}"
          MYSQL_DATABASE: hass_database
          MYSQL_USER: homeassistant
          MYSQL_PASSWORD: "${HASS_MYSQL_PASSWORD}"
          PUID: "${PUID}"
          PGID: "${PGID}"
        ports:
          - "3306:3306"
        volumes:
          - /home/Documents/home_assistant/mysql_data:/var/lib/mysql
    
      phpmyadmin:
        container_name: phpmyadmin
        image: phpmyadmin/phpmyadmin
        restart: always
        environment:
          PMA_HOST: mariadb
          PMA_USER: root
          PMA_PASSWORD: "${MYSQL_ROOT_PASSWORD}"
        ports:
          - "8080:80"
        depends_on:
          - mariadb
          
      zwavejs2mqtt:
        container_name: zwavejs2mqtt
        image: zwavejs/zwavejs2mqtt:latest
        restart: always
        tty: true
        stop_signal: SIGINT
        environment:
          - SESSION_SECRET=yourSuperSecretHere
          - ZWAVEJS_EXTERNAL_CONFIG=/usr/src/app/store/.config-db
        devices:
          - '/dev/serial/by-id/usb-Silicon_Labs_your_device-port0:/dev/zwave'
        volumes:
          - /home/Documents/home_assistant/z-wave_config:/usr/src/app/store
        ports:
          - "8091:8091" # port for web interface
          - "3000:3000" # port for Z-Wave JS websocket server
    
      npm:
        container_name: npm
        image: 'jc21/nginx-proxy-manager:latest'
        restart: unless-stopped
    
        ports:
          # These ports are in format <host-port>:<container-port>
          - '80:80' # Public HTTP Port
          - '443:443' # Public HTTPS Port
          - '81:81' # Admin Web Port
    
    
        environment:
          TZ: "Australia/Brisbane"
    
        volumes:
          - /home/Documents/home_assistant/nginx/data:/data
          - /home/Documents/home_assistant/nginx/letsencrypt:/etc/letsencrypt
          - /home/Documents/home_assistant/nginx/static_site:/static
          
      mosquitto:
        image: eclipse-mosquitto
        container_name: mosquitto
        restart: unless-stopped
        volumes:
          - /home/Documents/home_assistant/mosquitto:/mosquitto
          - /home/Documents/home_assistant/mosquitto/data:/mosquitto/data
          - /home/Documents/home_assistant/mosquitto/log:/mosquitto/log
        ports:
          - 1883:1883
          - 9001:9001
        networks:
          - my_shared_network
          
    networks:
      my_shared_network:
        external: true
        

    I stored the passwords in a .env file in the same directory as the docker-compose.yaml file. Docker compose automatically loads this file if it exists and sets the environment variables.

    # .env file
    MYSQL_ROOT_PASSWORD=MyReallySTrongPassword
    HASS_MYSQL_PASSWORD=AnotherGoodPassword
    PUID=1000
    PGID=1000

    To start all the containers just run the command.

    $ docker compose up -d

    You can monitor that everything is working by issuing the docker ps command.

    docker ps --format "table {{.Names}}\t{{.Image}}\t{{.Status}}"
    NAMES           IMAGE                                          STATUS
    npm             jc21/nginx-proxy-manager:latest                Up 11 days
    docker2mqtt     docker2mqtt-docker2mqtt                        Up 11 days
    phpmyadmin      phpmyadmin/phpmyadmin                          Up 11 days
    homeassistant   ghcr.io/home-assistant/home-assistant:stable   Up 11 days
    mariadb         mariadb:latest                                 Up 11 days
    mosquitto       eclipse-mosquitto                              Up 11 days
    zwavejs2mqtt    zwavejs/zwavejs2mqtt:latest                    Up 11 days
  • Chasing down electricity usage

    Chasing down electricity usage

    Working to minimise usage

    We will be using our battery to power our electric heating and so we want to minimise usage. After setting up the monitoring of energy flow in Home Assistant I noticed that we were drawing 300W-400W of energy overnight. This ends up using about 10%-15% of our battery storage.

    There are a number of things in the house which we leave on overnight and draw some power. The fridge obviously, but also the wireless routers, a few raspberry pi computers and some LED lights. Looking at the sources I knew about, it still seemed like less than 400W.

    Looking for the unknown usage

    I have been using a couple of Shelly 1PM devices to switch on and off and monitor our coffee machine, and other appliances. These are easily integrated into home assistant and very reliable. I used one of them to monitor some of our appliances and nothing looked like a huge user of power.

    I decided to try and measure everything we kept powered on at night. To do this I purchased a bunch of inexpensive Tapo smart plugs and integrated them into HA.

    What the usage looks like

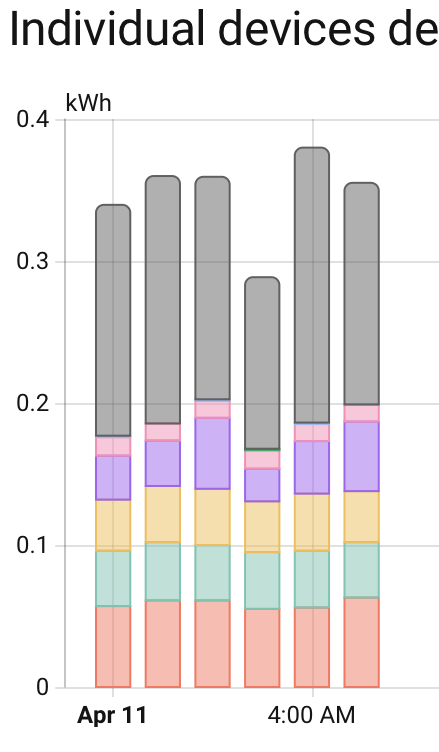
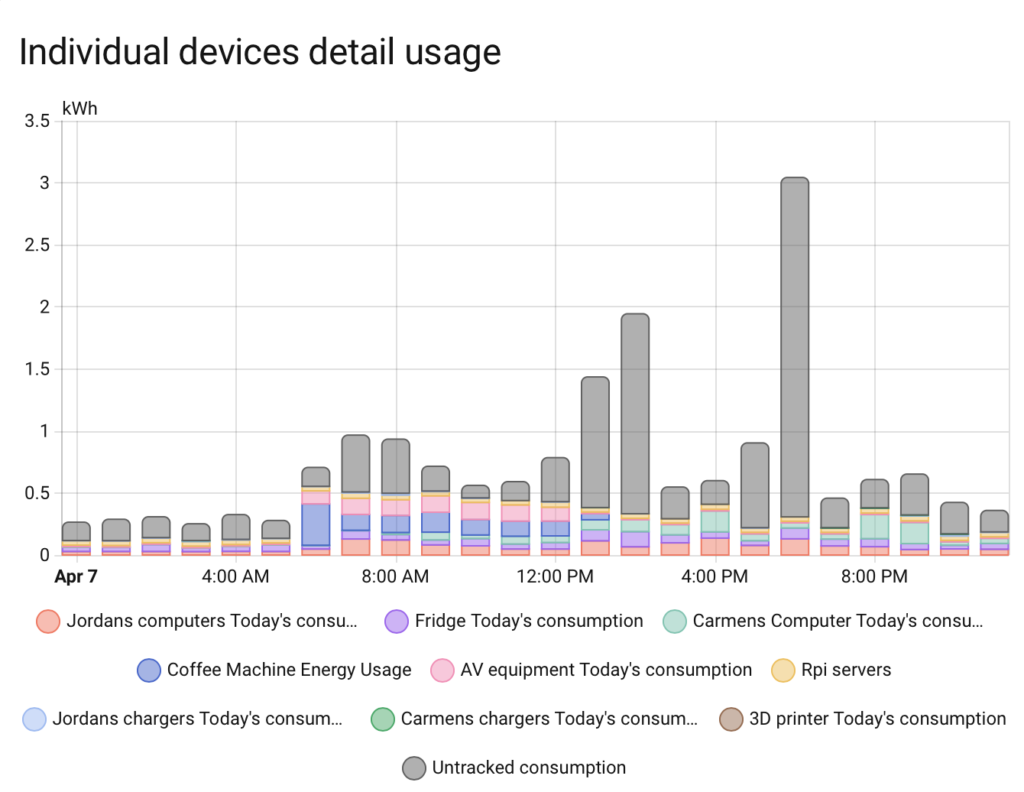
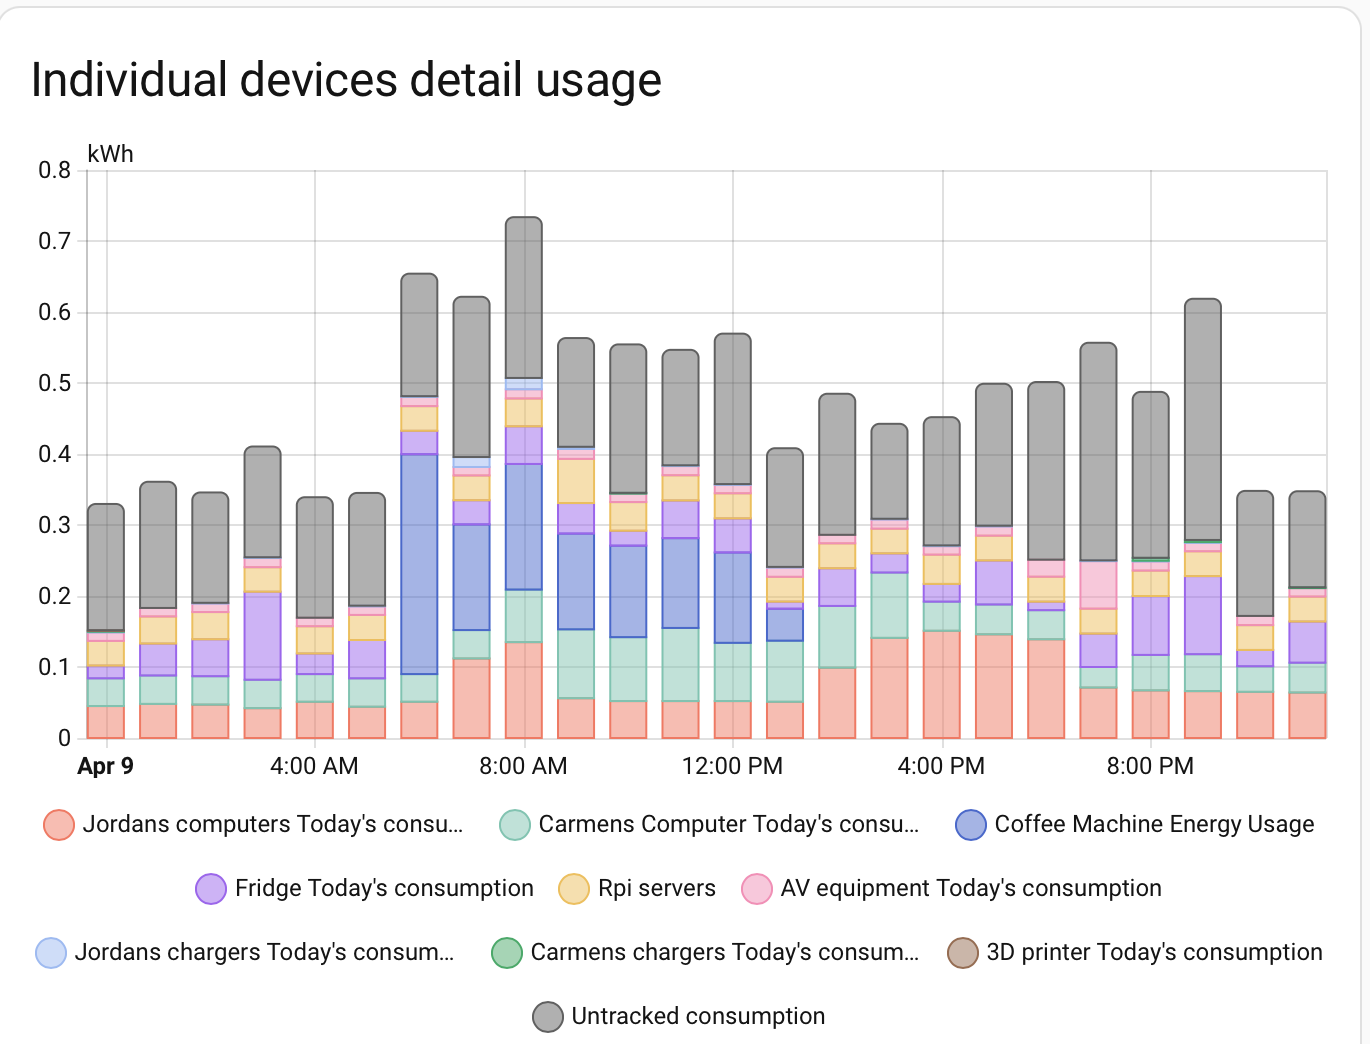
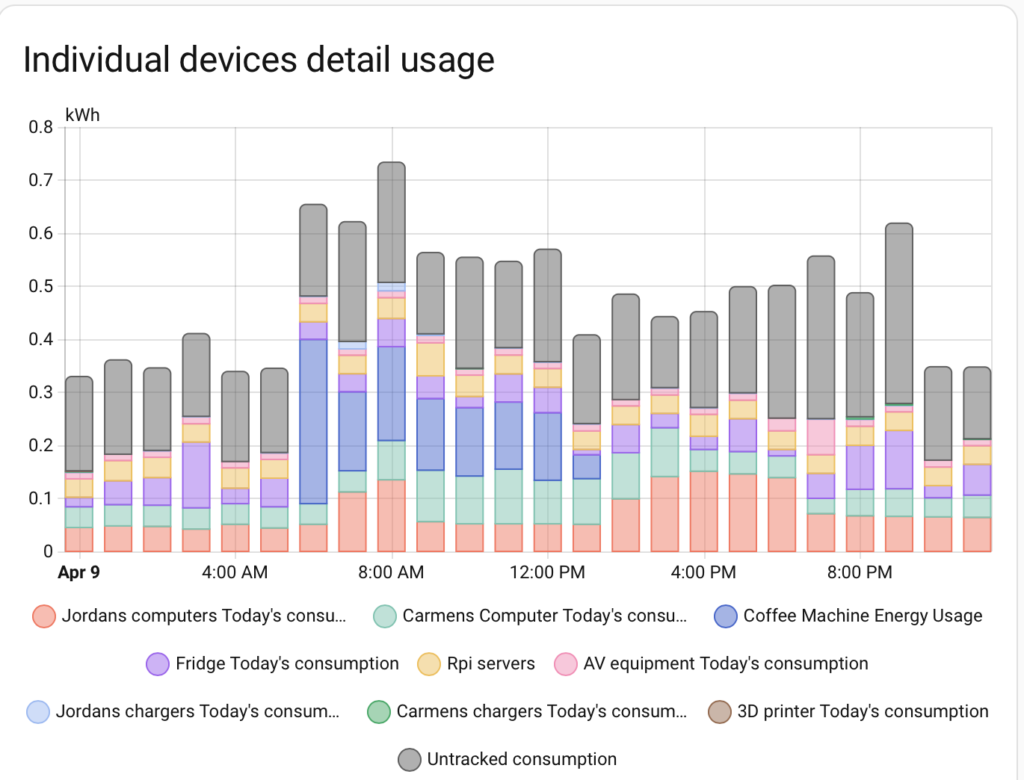
    Although I don’t monitor everything I did try to assess all the usage. I checked every outlet in the house, and measured everything that was plugged into them at least once. I left the Tapos on the biggest users, and assessed that the unmeasured devices draw less than 20W. The chart below shows all the devices I measure. Dark grey is untracked consumption. During the day there are a handful of appliances I don’t measure. These include the stove, hair dryers, the kettle. I can clearly see spike in usage during the day when these are on.

    Daily usage measurements. Untracked usage is dark grey.

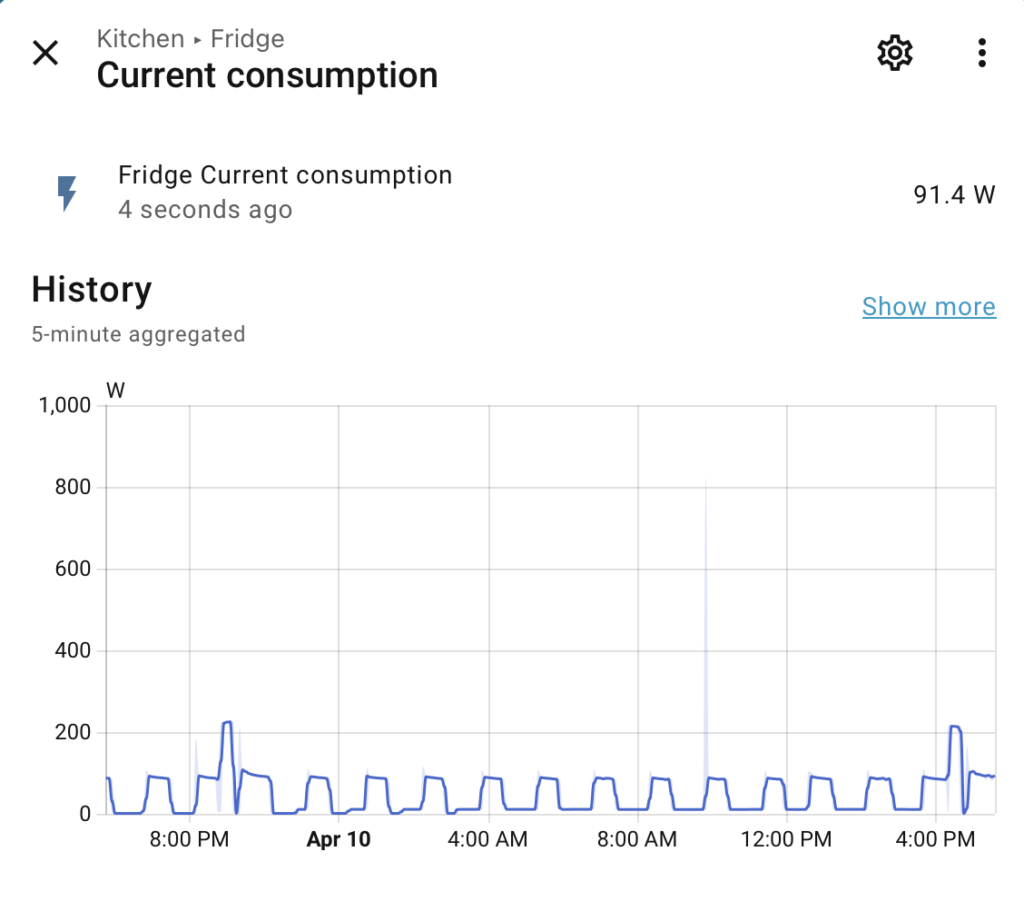
    Overnight usage on the other hand is pretty steady, and only the fridge fluctuates its current draw as it cycles its cooling on and off.

    Fridge power usage during a day. It draws between 10W and 100 W as it cycles on and off.

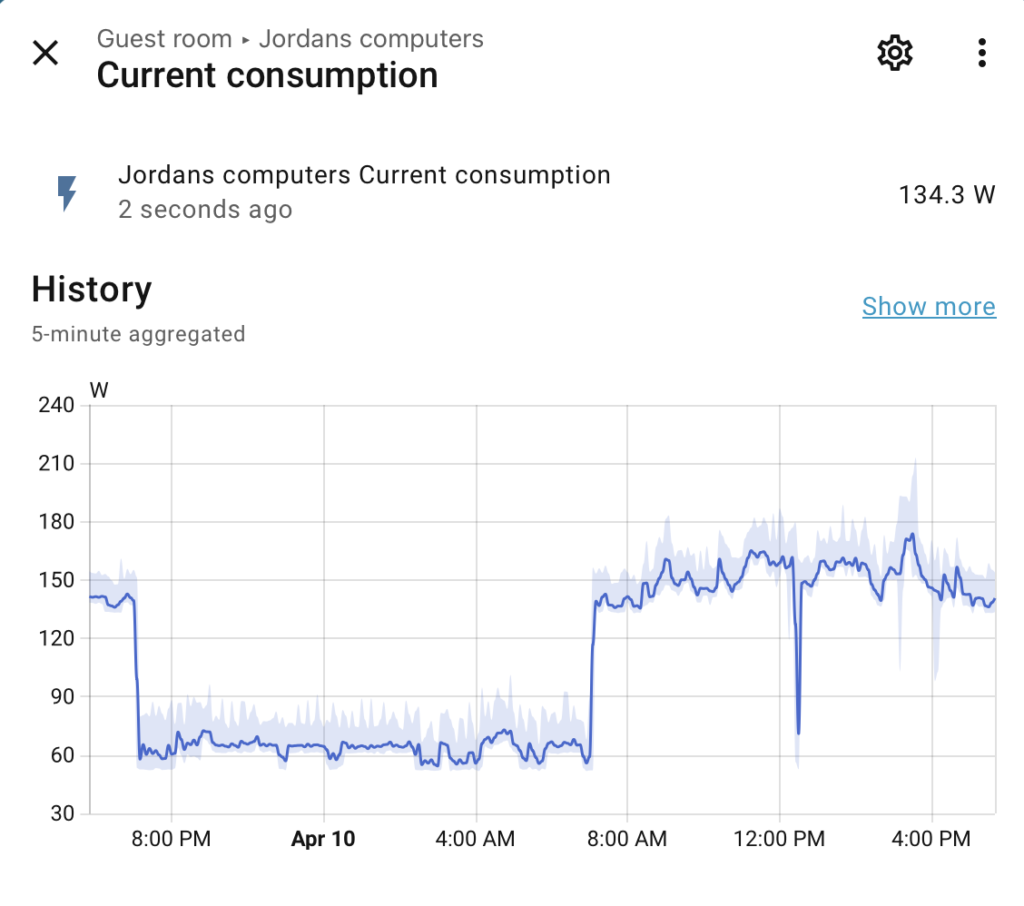
    Some of the servers remain on overnight, but their current draw is steady around 60 W for this group.

    Computer usage during a day. Some of the computers remain on and draw 60W overnight.

    After tracking the overnight current draw for a number of nights it was clear the current draw was consistent. It was also clear that the power being used in the house was not 300W-400W. Adding up all the measured usage and also estimating the contributions for devices I not measuring the current draw at night is closer to 150W-250W.

    Battery discharge does not equal power usage

    There isn’t any mysterious device hidden somewhere drawing 100W. The statistic of total energy usage in Home Assistant is essentially the battery discharge as we are not drawing from the grid. The current we draw overnight is less than the battery discharge. The most likely reason for this seems to be the inverter.

    Our battery needs to convert DC to AC in order to power the house. This is quite efficient when there is a large current draw, but for small current draws it seems to be much less efficient. This seems to be responsible for most of the untracked consumption which shows up overnight in the figure above. It has been useful understanding all the appliances which do draw power, and I will need to consider whether I want to power some of them off overnight.

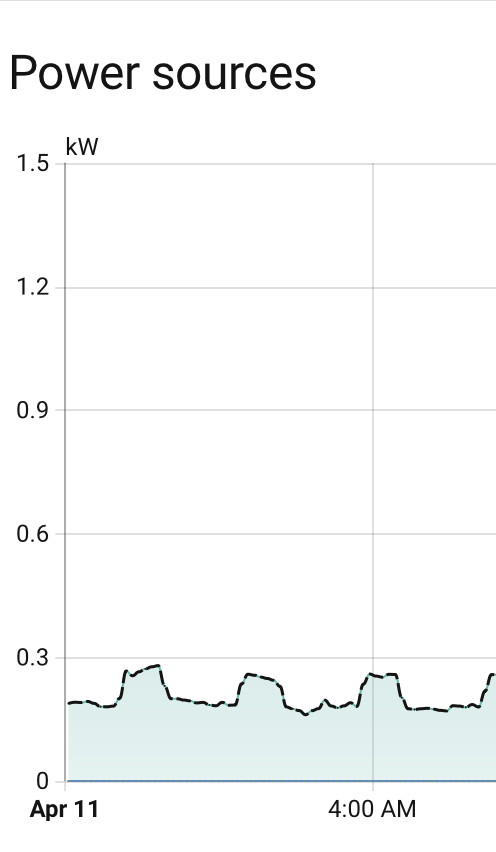
    Closer look at overnight usage

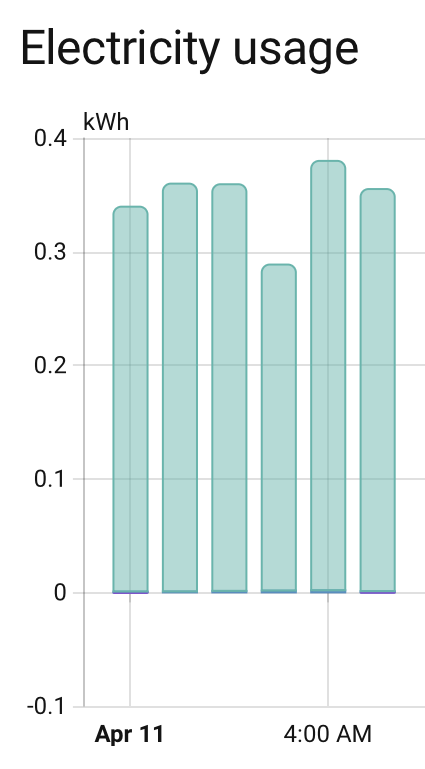
    The images above on the left shows the power consumption in kW being used in the house overnight. The middle image shows all the measured energy use in the same period. The image on the right shows the measured energy being discharged from the battery to feed the household usage. The untracked (dark grey) in the middle plot is mostly coming from inverter losses.

  • Measuring energy flow with Home Assistant

    Measuring energy flow with Home Assistant

    Energy flow in the HA dashboard

    Understanding the energy flow in our household will be critical in trying to reduce dependence on the grid. We also want to maximise our use solar energy.

    Summary tab

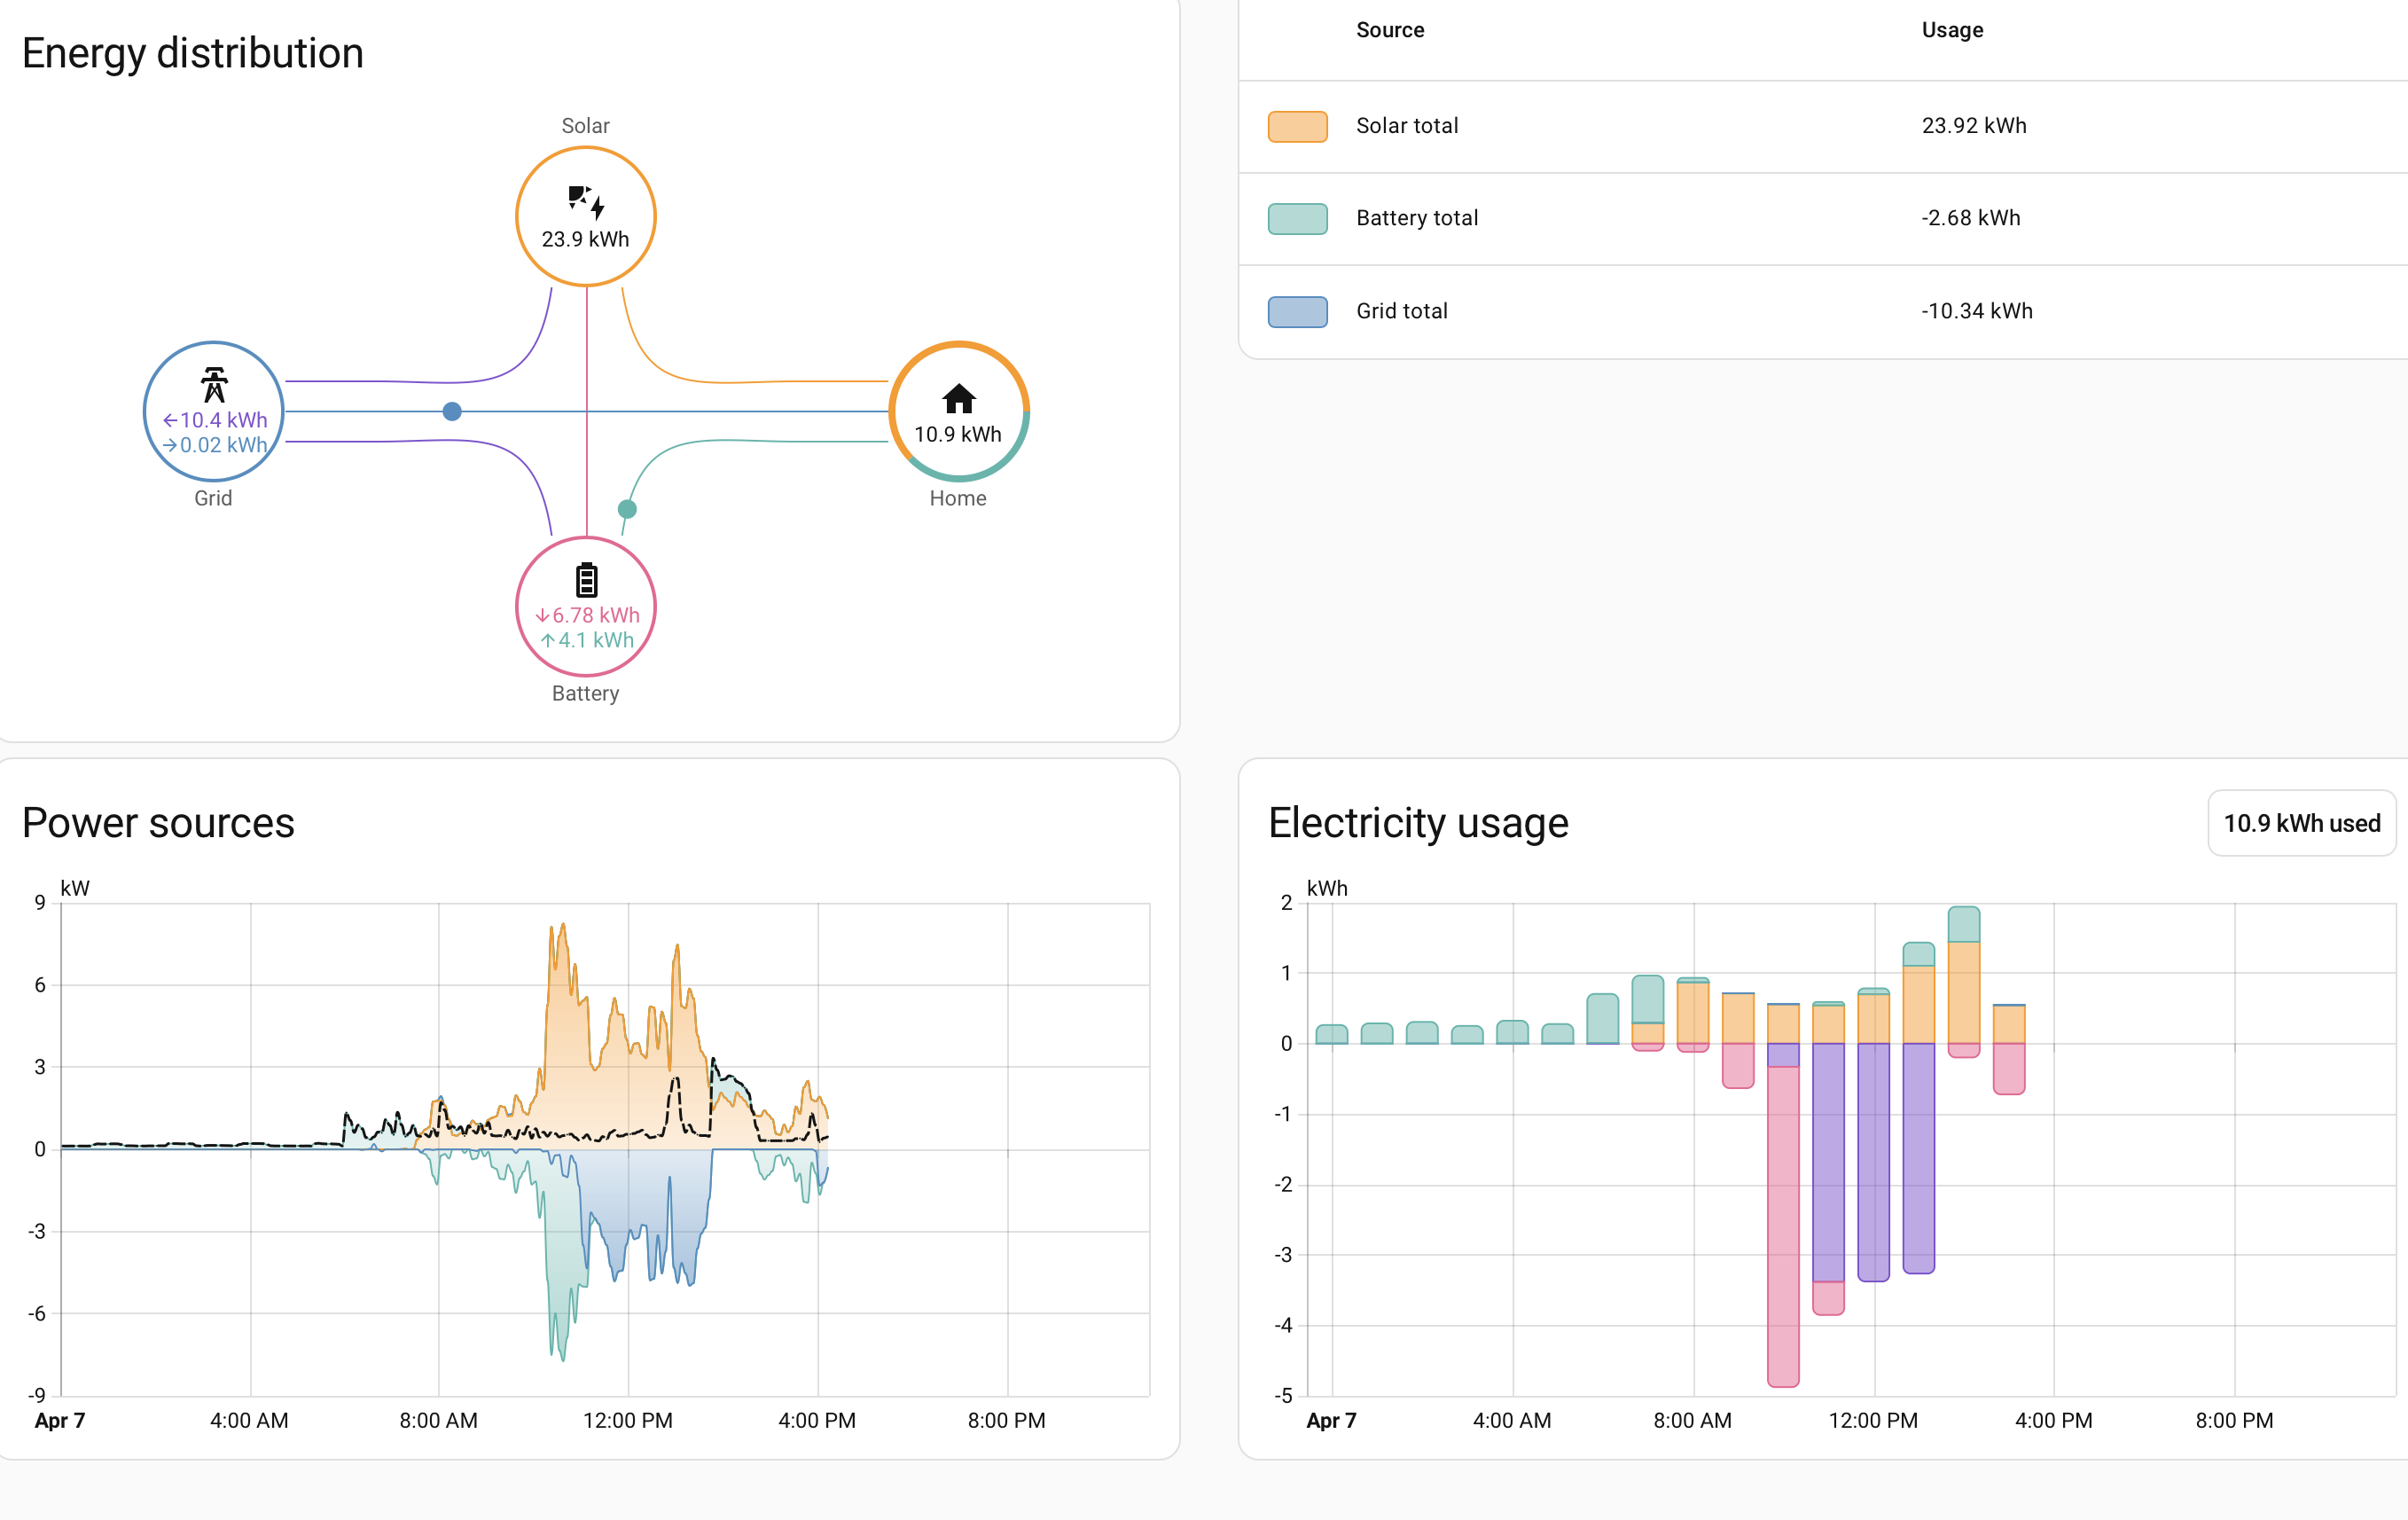
    The HA Energy dashboard Summary tab provides useful overview on where and when we are producing and using energy.

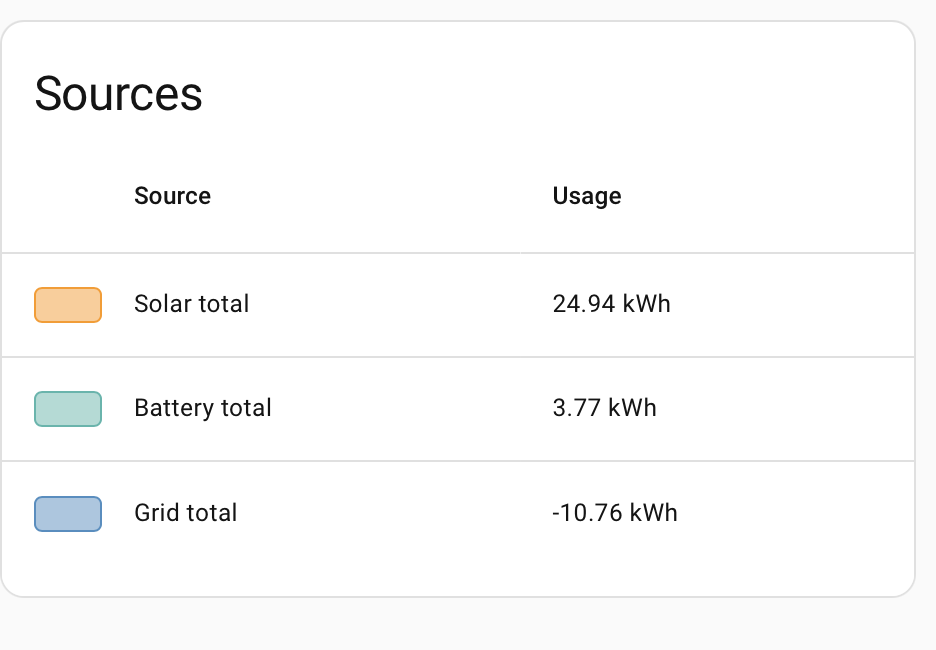
    The Sources pane on the dashboard shows net usage from solar, the battery and the grid. On this day we used around 25kWh from the solar for the home and to charge the battery. We fed in the rest to the grid. Our net use of the battery was 3.77 kWh as we used more from the battery this day than usual.

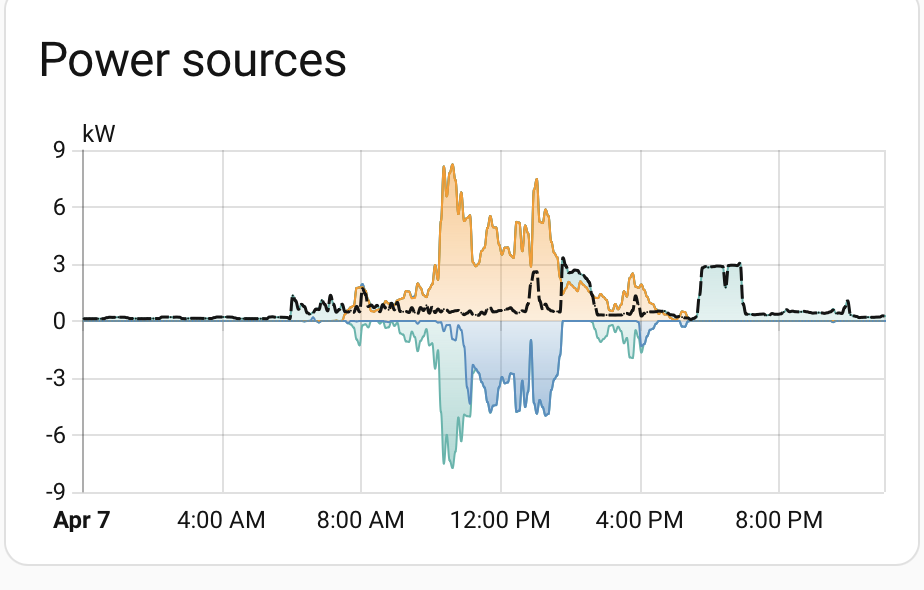
    The Power sources pane shows the energy flow during the day. Here we see the battery use during the evening (cooking ) and then a small steady amount of overnight usage. During the day, the solar charges up the battery, and provides all our home’s electricity. The Solar which is left over is fed back to the grid.

    Energy tab

    The Energy tab in the dashboard offers a number of useful diagnostics for seeing where energy is being used and produced in more detail.

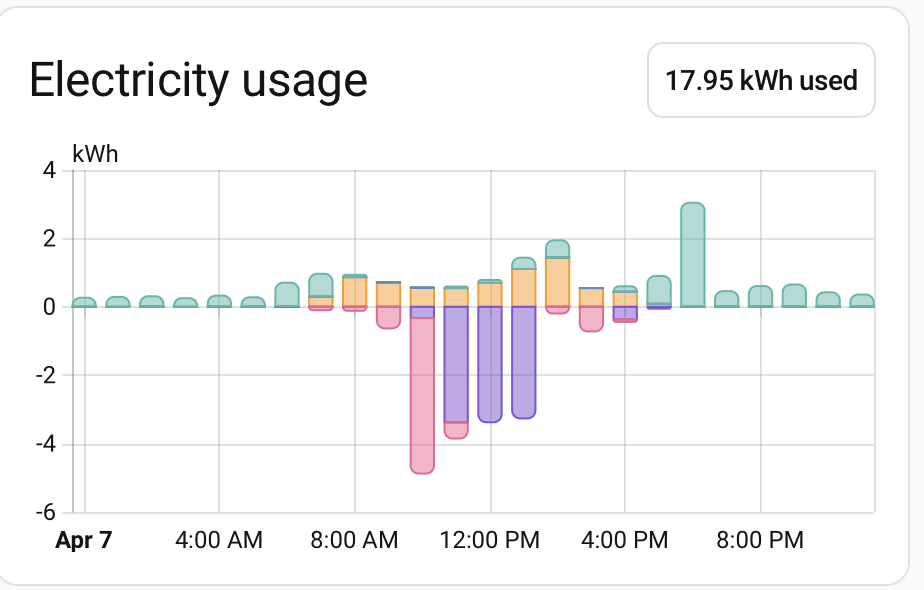
    The Electricity usage pane details where we use electricity (on an hourly basis). This shows the battery charging in pink, the grid feed-in in purple. The household use from battery is in green and household use from solar in orange.

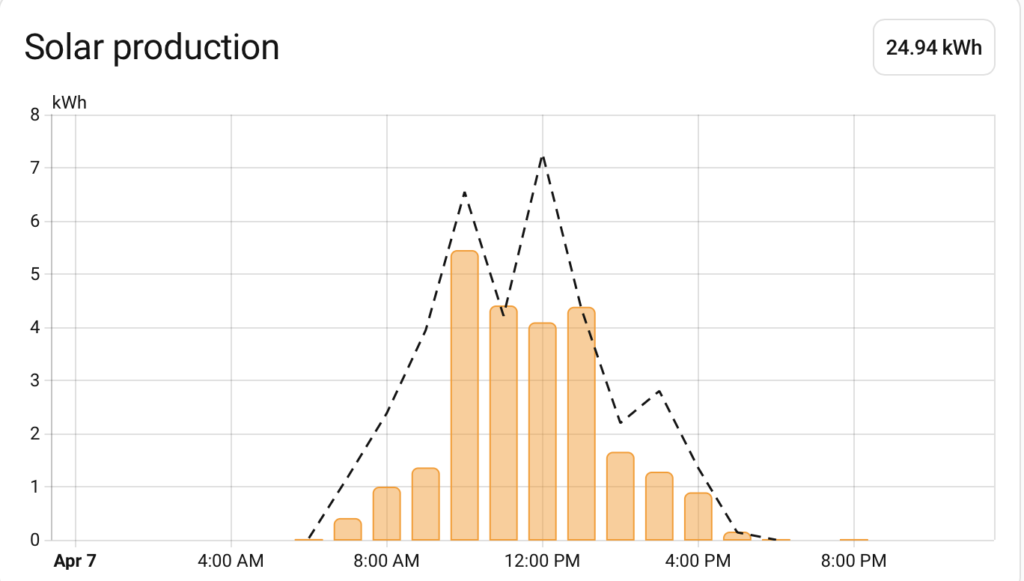
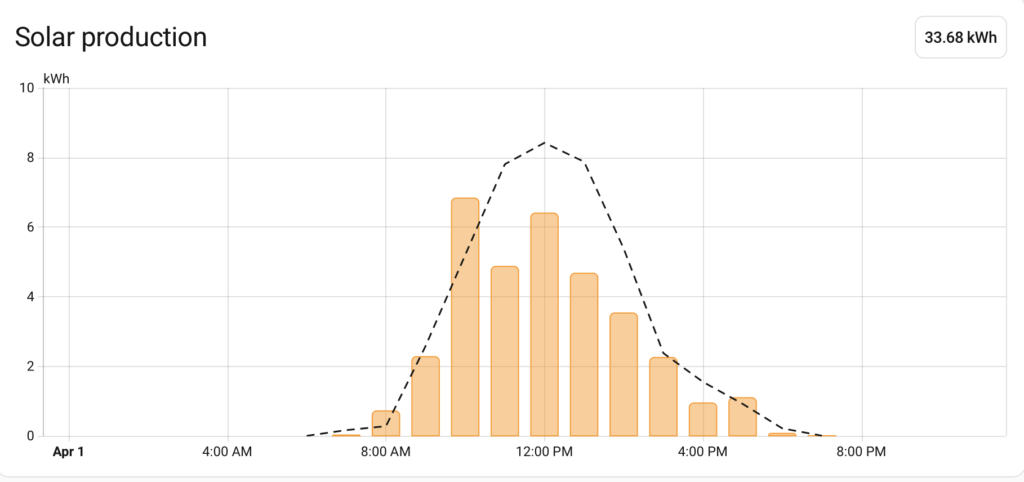
    The Solar production pane gives an hour by hour look at the solar produced, and also shows the prediction for what we expected given by the solcast integration.

    There is also the possibility to track more detailed use of individual devices. The summary plot looks like this.

    I have put in a number of devices to track electricity usage in the household. I haven’t tracked everything, there are big untracked spikes from running the washer/dryer and the oven. There was something which was really bothering me though. We are using the battery to run everything overnight, and there was a steady draw on the battery of around 250 watts overnight. I tried to find if there was a culprit for this. I’ll describe what I did to measure this, and what I found out in another post.

  • Predicting solar performance with Solcast

    Predicting solar performance with Solcast

    In order to better understand how to monitor and control our appliances to take maximum advantage of available solar energy, predicting the likely solar availability is vital.

    On sunny days in the summer our system could produce more than 80kWh of energy, while on a dark rainy winter day, this could be less than 10 kWh. Knowing whether there will be sun available to recharge the battery and run the heating will help planning when we need to recharge from the grid. Our supplier offers free electricity for three hours during the day, so knowing when we need to take advantage of this can be helpful

    Predicting the solar energy our system will produce

    In order to make an accurate solar energy prediction, we need to know a few things. Where on the planet the panels are located, how many panels and which direction they are pointing. What the weather is predicted to be for the day.

    Even with this information, it is difficult to do all the calculations. Luckily there is Solcast which is a company providing this information to solar panel users around the world. They offer a free hobbyist service to anyone with home panels.

    Registering for the Solcast solar prediction service

    In order to register you can go to the Solcast API Toolkit and create a free account. Once you have registered, you can add a home PV system. Each account can have up to two free home PV systems. You then need to enter the location of your panels, and information about the orientation, the number of panels, the capacity and tilt of the panels.

    Determining the orientation of your PV panels

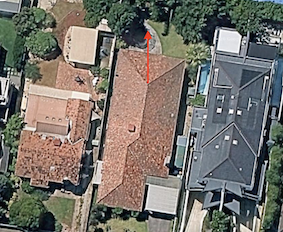
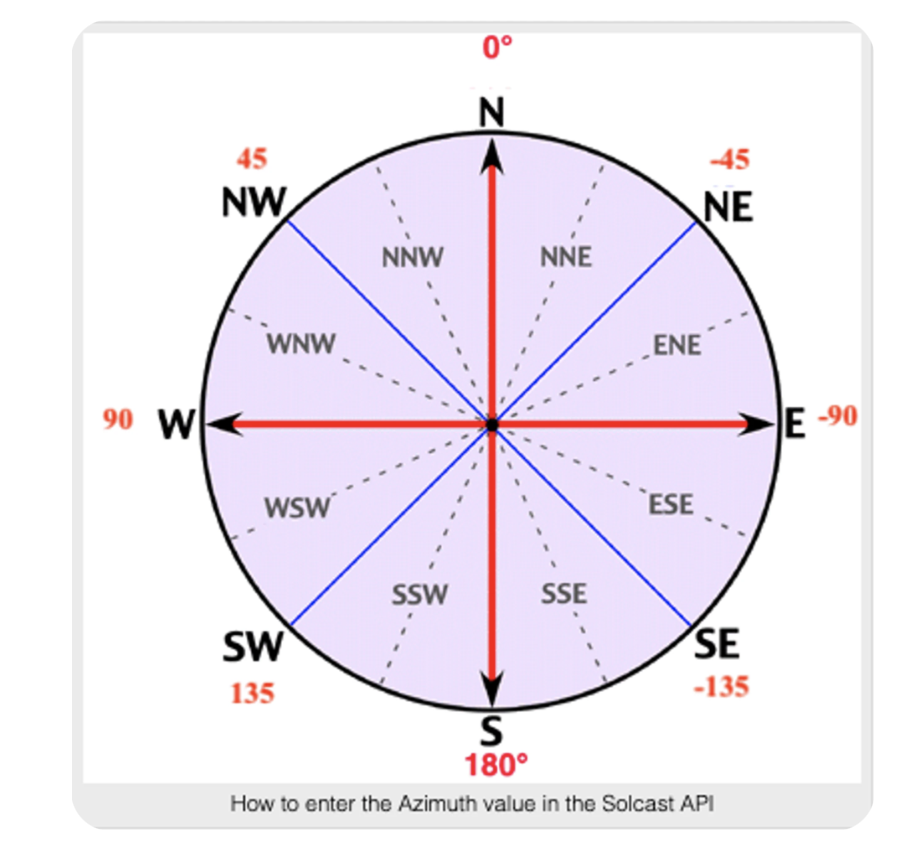
    The easiest way to determine the direction your panels are oriented is to find your home on google maps, and the draw an arrow which points in the direction of your roof. In the case of Melbourne the street grid is aligned 8 degrees from true North, and the North facing panels point at -8 degrees.

    Arrow pointing to true north

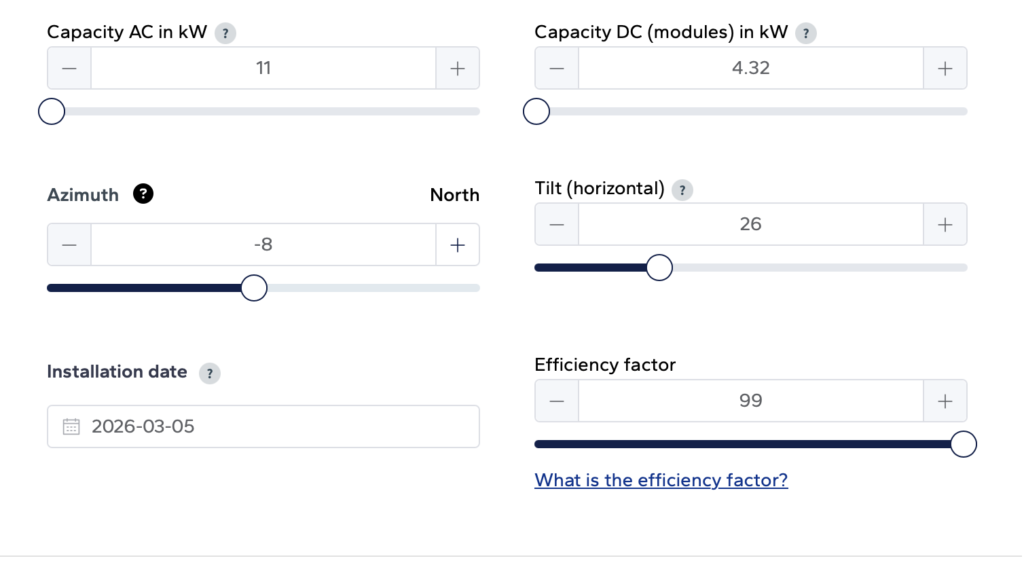
    I measured the tilt of the tiles by using a phone app and placing it the roof aligned with the PV cells. The parameters for the system are entered as shown below.

    entering parameters of your solar panels into solcast
    Entering parameters for Solcast home PV system

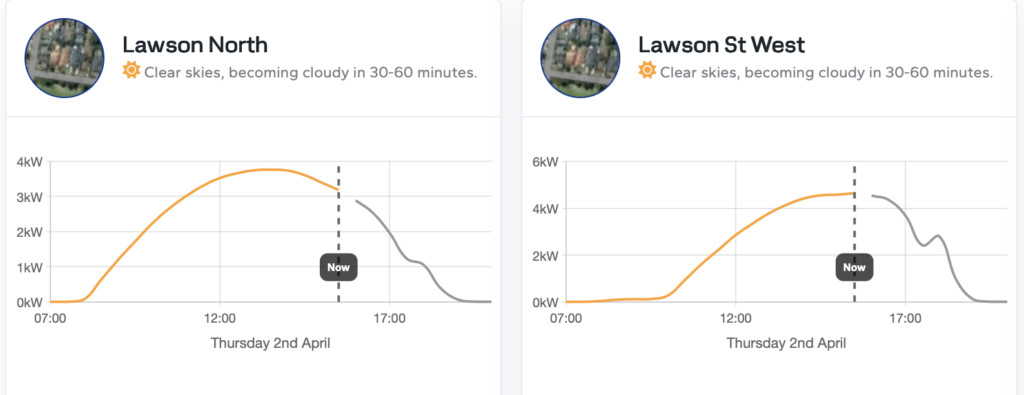
    When you have entered your systems you will see a dashboard showing the actual and expected solar energy your panels should produce for today, and a prediction for the next few days.

    Dealing with multiple PV strings

    Our solar installation has panels facing three orientations. Solcast limits the free PV models for each account to two systems. If you have more than two, you can create an average over two or more of the PV strings to give an approximation. Otherwise you will need to have another account to model the extra strings. The integration for Solcast in Home Assistant can deal with this.

    Adding the Solcast solar prediction data to Home Assistant

    There is a HACS integration for Home Assistant which neatly brings the data in from your Solcast model. You can find it at ha-solcast-solar, and add it in the usual way you add HACS integrations.

    This integration asks you to add information about your model, including the API key. You can add multiple strings of PVs when you are setting up the integration.

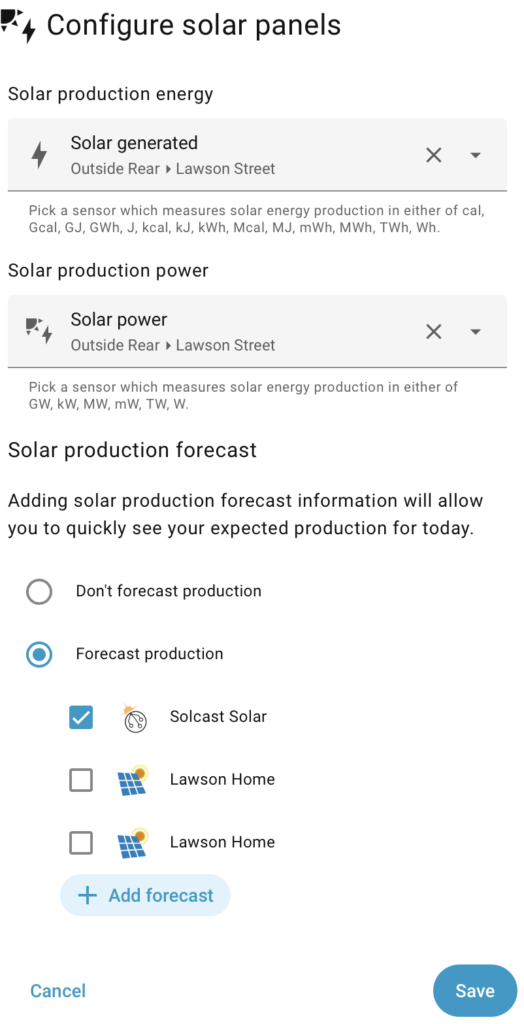
    You then need to add this on the Energy Dashboard of Home Assistant. This is done in the Solar Panels section of the dashboard. You will need to edit the solar generated item you added previously (Using home assistant for monitoring battery and solar) and you will have the option of adding the solcast forecast.

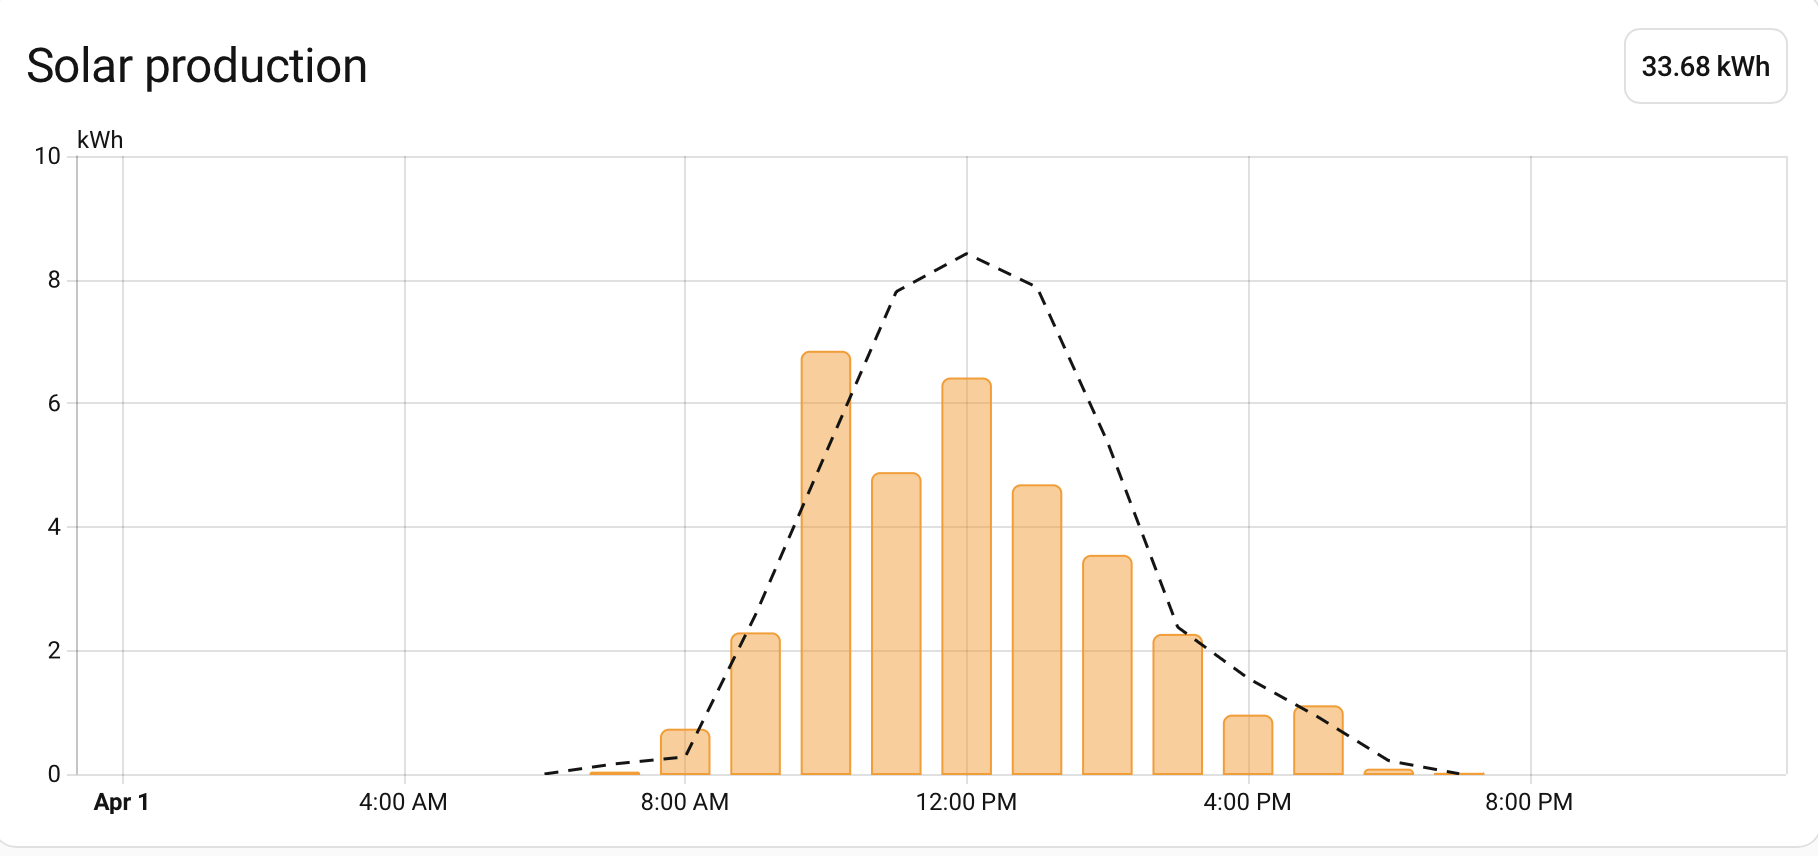
    When you have added the forecast, the Energy Dashboard will now show both the prediction (dotted black line) and the measured solar power from your panels.

    Solcast prediction and measured solar production in Home Assistant

  • Using home assistant for monitoring battery and solar

    Using home assistant for monitoring battery and solar

    We have been using home assistant for monitoring and controlling many items in our home for a few years. This is a fantastic open source home automation system, and is ideal for monitoring energy usage. It can also be used for controlling use and charging of a battery taking into account tariffs, solar input. We also plan to use it to monitor and control the HVAC system and the hot water heat pump.

    We considered a number of different solutions for battery storage, and decided to go with a Tesla Powerwall 3 solution. This is a mature and well tested system, even if we had some worries about the CEO. Our system has two Powerwalls giving 27.5 kWh of storage along with a gateway. This setup gives us whole home backup, and the inverter is built into the Powerwall.

    Home assistant has a pretty good setup for monitoring energy usage documented at HA energy dashboard. The dashboard needs to be able to read out the information from the inverter, battery, grid usage, and solar production. Many battery and inverter systems are able to be integrated with home assistant in a straightforward manor. The Tesla Powerwall app which allows the user to control and readout the battery is a little more locked down.

    Getting access to the Powerwall data

    There are however several ways to get this data into home assistant.

    1. Locally read the data by connecting to the wifi which is on the Powerwall.
    2. Access Tesla’s developer API.
    3. Use a paid third party solution to access the Tesla API and get up and running quickly.

    I explored, and managed to get all three of these options working, but in the end I am using the third option with my HA setup. It works flawlessly, is quite affordable, and prepares all the sensors needed to setup the energy dashboard in home assistant. The downsides of this approach are that it depends on access to the Tesla cloud, and costs a small amount of money.

    If you are interested in either of the first two options, I recommend having a look at the excellent pypowerwall python library https://github.com/jasonacox/pypowerwall. This has code to access the data provided by the battery. There is also a wealth of information about how to connect to either the local wifi or the cloud.

    If you want to connect to the local wifi, be sure to take a photo of the inside of the Powerwall when it is being installed. There is a sticker in there which has the SSID : (something like TeslaPW_XXXXXX) and Password on it which you will need to connect to the wifi. You can connect a computer to this wifi, and then can use the TEDAPI in pypowerwall to access the local data from your battery. This gives access to information like the power on each string of PV panels.

    The quick solution – using Teslemetry

    There are a lot of complications in getting this data into home assistant, but if you have enough IT skills it is doable. If you want to connect to the Tesla API without paying, you need to register on the Tesla portal (https://developer.tesla.com). This allows you to make calls and get information about your battery without paying. Again, if you have sufficient IT skills, you can do this. I set up an account, and managed to make the API calls, but opted for the easier solution in the end.

    Using the Telslemetry solution https://teslemetry.com makes it incredibly easy to integrate the data from the battery into home assistant, and costs only a few dollars a month. In the end it was worth it to subscribe, and be up and running reliably and immediately rather than spending a lot of time rolling my own solution.

    After subscribing to Teslemetry, and adding the integration into home assistant, I was able to setup the home assistant energy monitoring with the sensors defined by Teslemetry.

    Setting up the Home Assistant energy dashboard

    When you setup your Powerwall with the Tesla app, you give the system a name. You will need to edit the energy dashboard in HA, and enter 6 sensors. The sensors which are available and wher to enter them in the dashboard are (for a:

    1. My system Grid Imported (add to Electricity Grid/Grid Consumption)
    2. My system Grid Exported (add to Electricity Grid/Return to Grid)
    3. My system Grid Power (add to Electricity Grid/Grid Power)
    4. My system Battery Charged (Home battery storage/Battery systems)
    5. My system Battery discharged (Home battery storage/Battery systems)
    6. My system Solar generated (Solar panels/ Solar production)

    After doing this, there is lots of information provided by the energy dashboard in home assistant.